Home SellingWindermere Bellevue Commons News April 26, 2017

3 Charts That Shout, ‘List Your Home Today!’

3 Charts That Shout, ‘List Your Home Today!’ | MyKCM

In school, we all learned the theory of supply and demand. When the demand for an item is greater than the supply of that item, the price will surely rise.
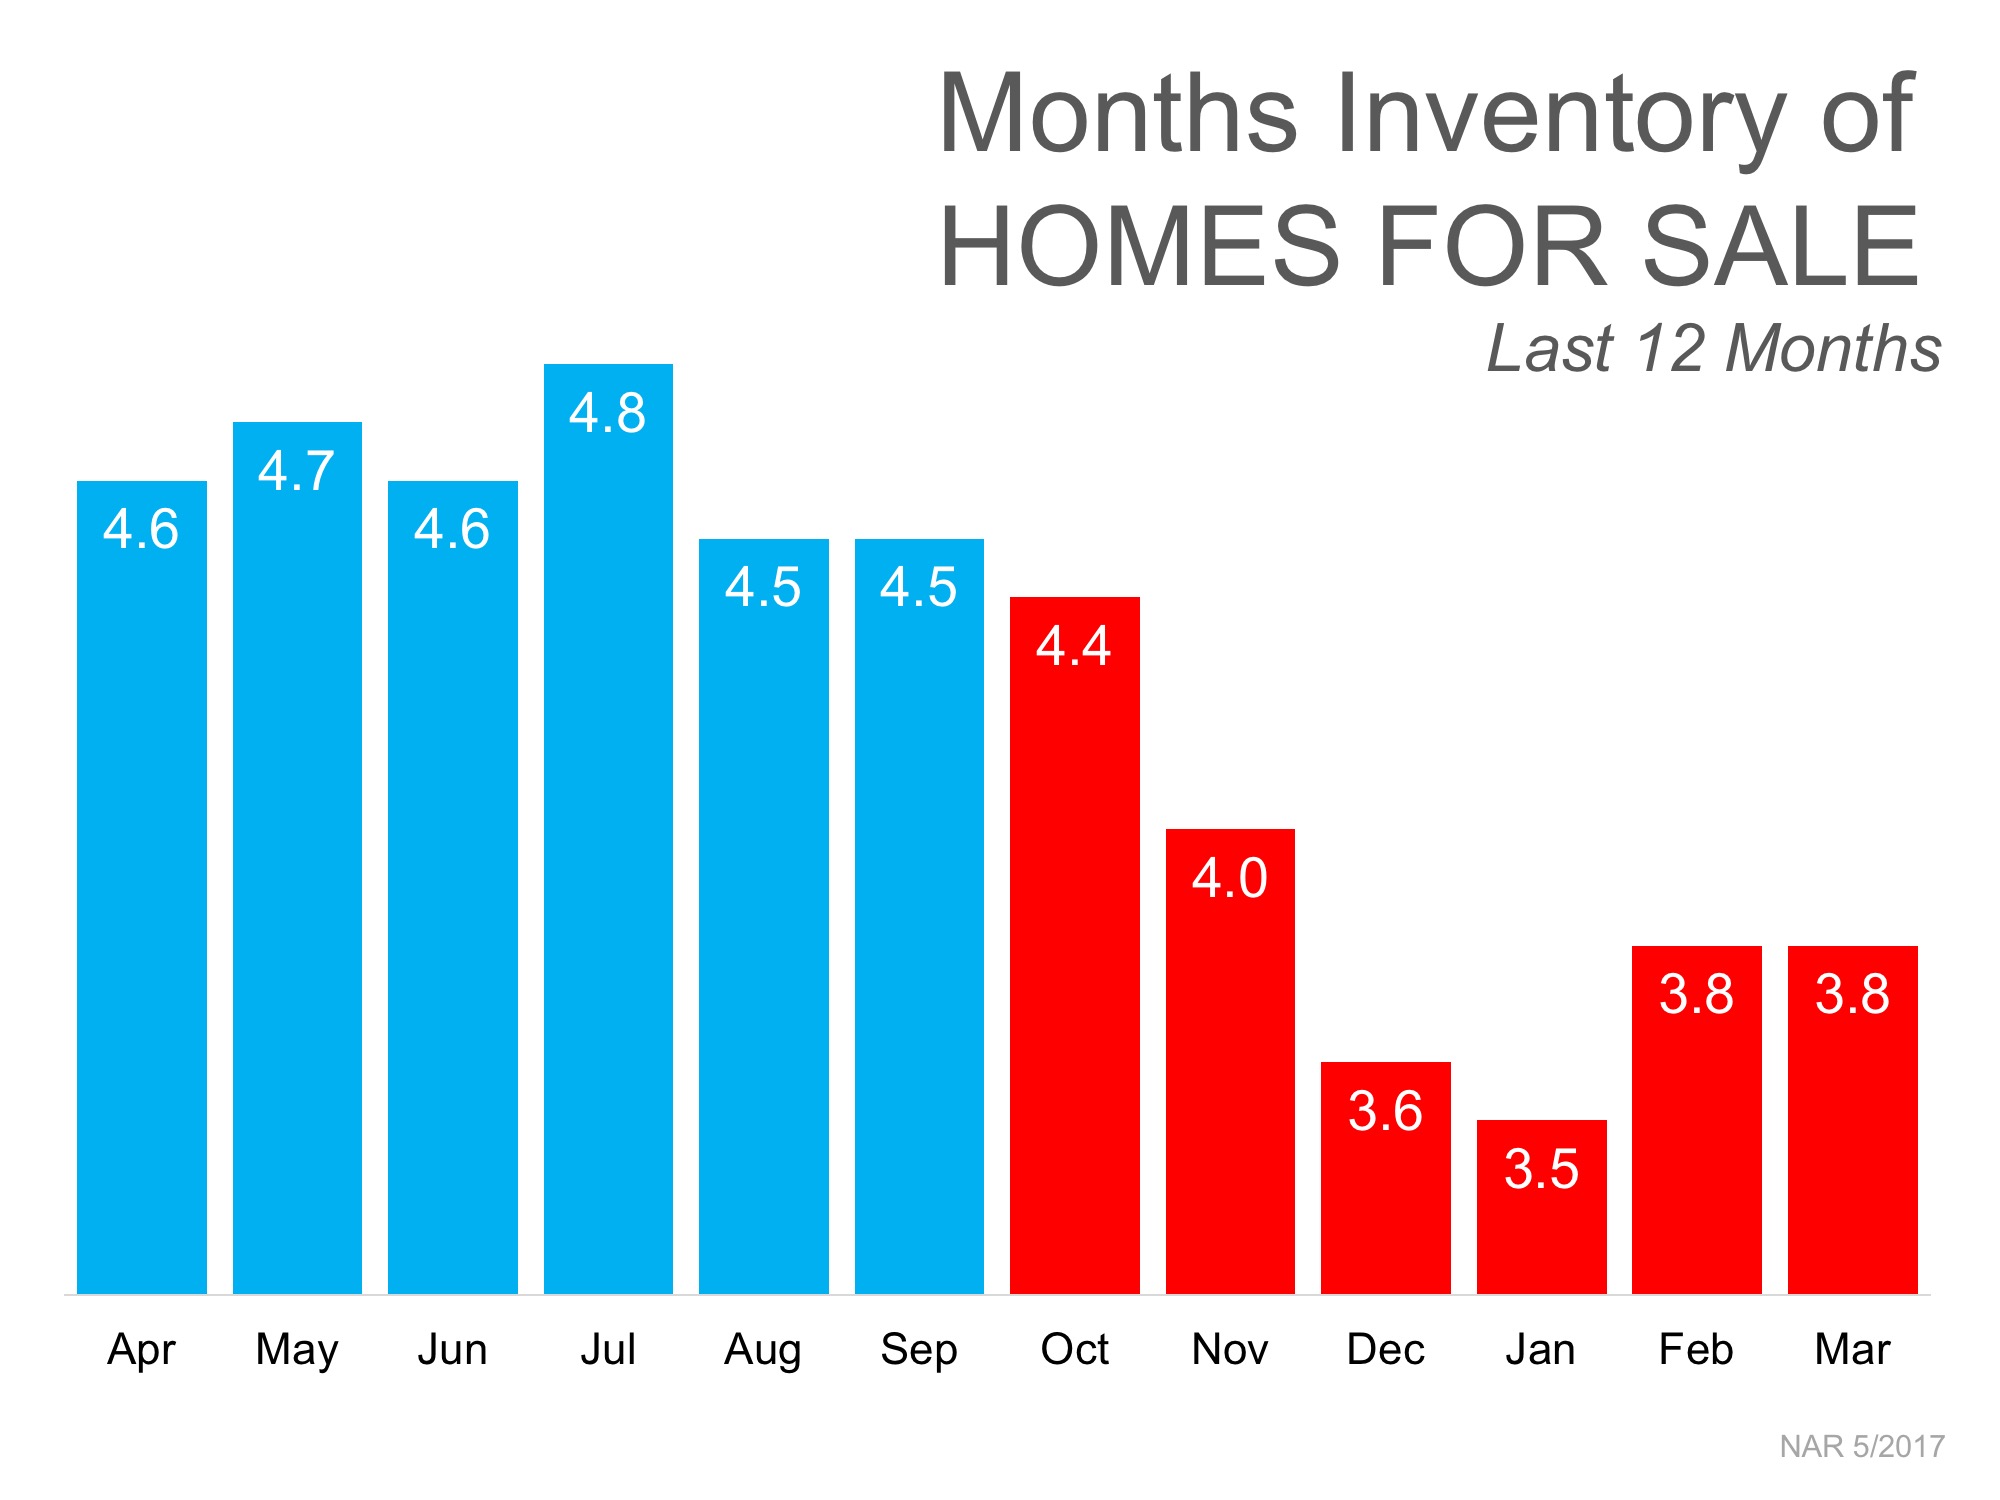
SUPPLY

The National Association of Realtors (NAR) recently reported that the inventory of homes for sale stands at a 3.8-month supply. This is considerably lower than the 6-month supply necessary for a normal market.
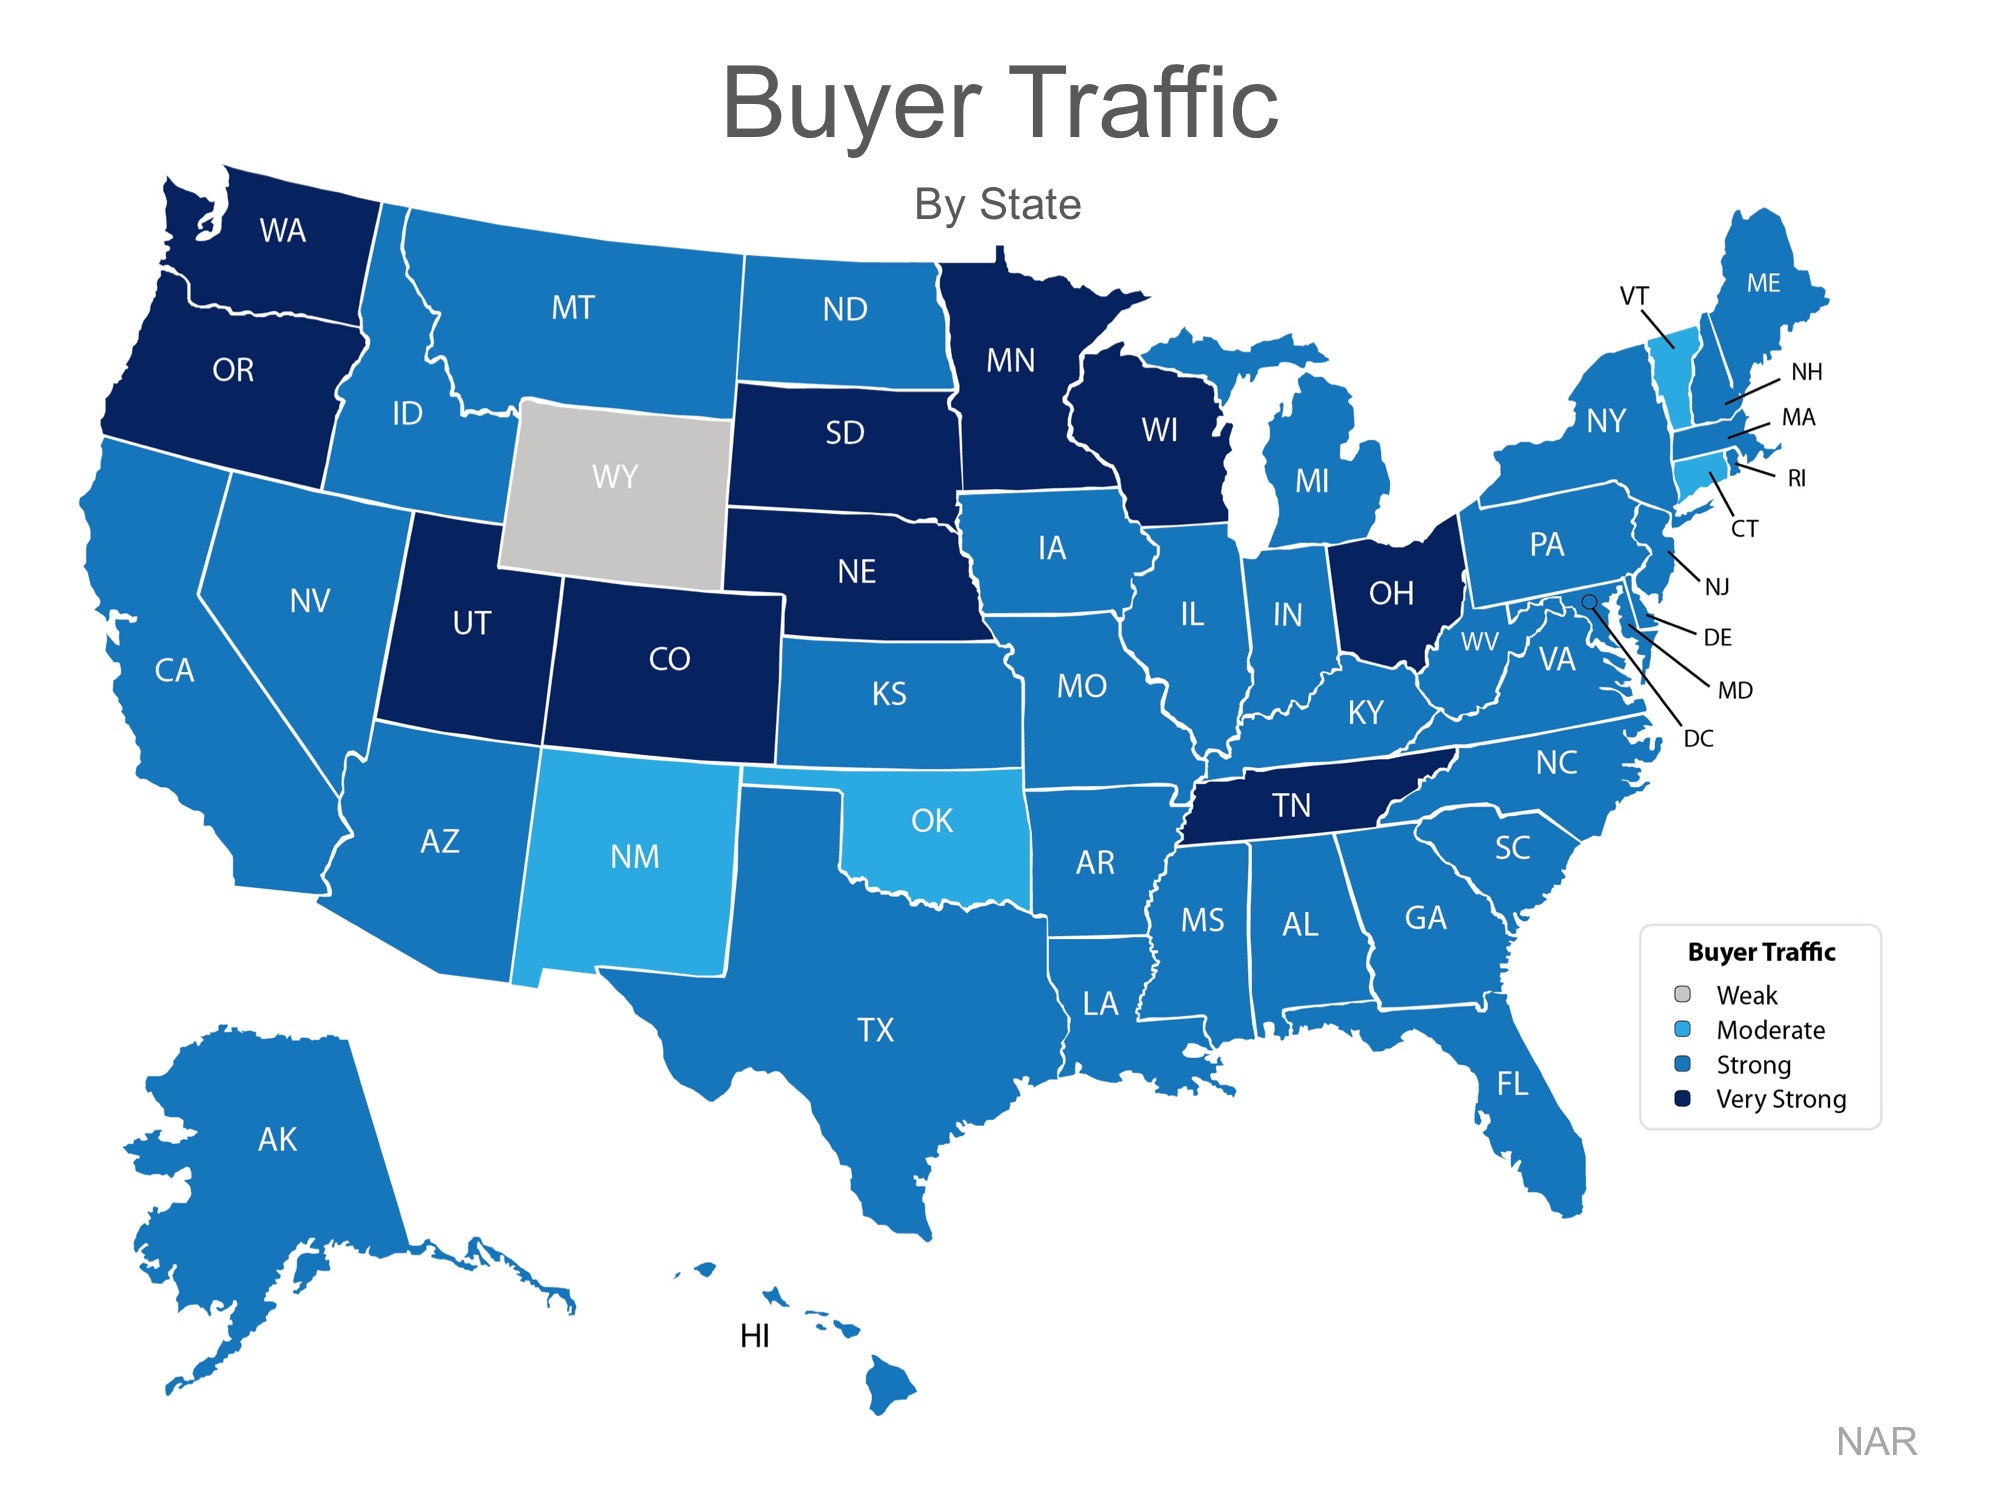
3 Charts That Shout, ‘List Your Home Today!’ | MyKCM


DEMAND

Every month NAR reports on the number of buyers out in the market looking for homes, which is also known as buyer traffic. As seen on the map below, buyer demand in March was strong or very strong in 45 out of 50 states nationwide, and Washington, DC.

3 Charts That Shout, ‘List Your Home Today!’ | MyKCM

Many buyers are being confronted with a very competitive market in which they must compete with other buyers for their dream homes (if they are even able to find a home they wish to purchase).

Listing your house for sale now will allow you to capitalize on the shortage of homes for sale in the market, which will translate into a better pricing situation.
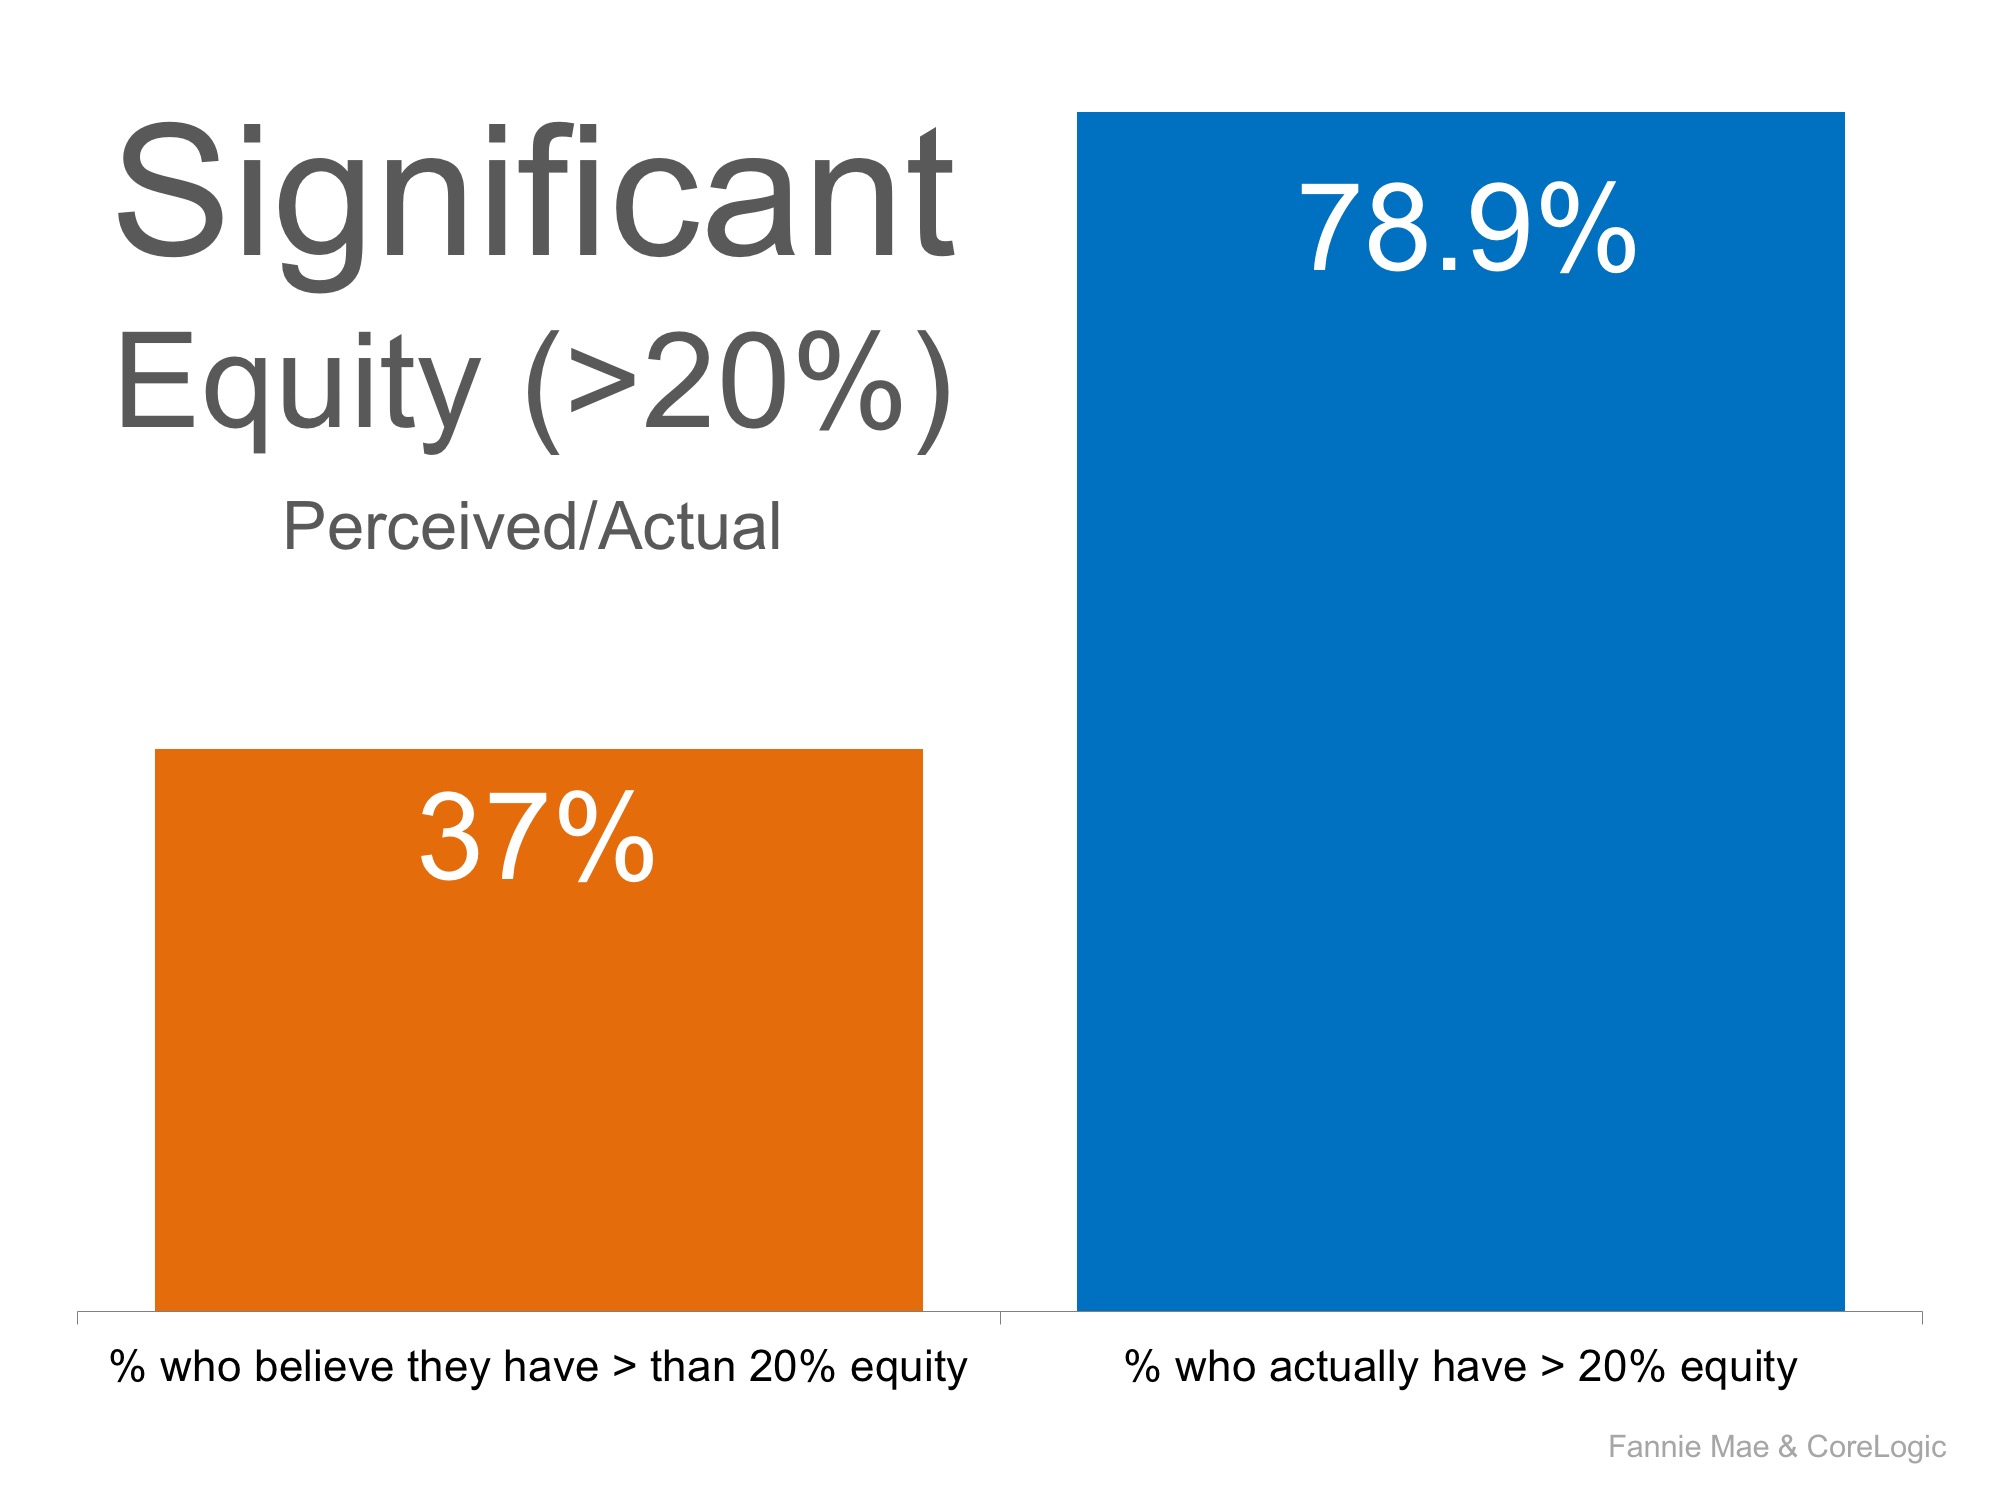
HOME EQUITY

Many homeowners underestimate the amount of equity they currently have in their homes. According to a recent Fannie Mae study, 37% of homeowners believe that they have more than 20% equity in their homes. In reality, CoreLogic’s latest Equity Report tells us that 78.9% actually do!

3 Charts That Shout, ‘List Your Home Today!’ | MyKCM

Many homeowners who are undervaluing the equity they have in their homes may feel trapped, which may be contributing to the lack of inventory in the market.

Market StatsWindermere Bellevue Commons News April 12, 2017

King & Snohomish County Market Stats – March 2017

What’s Happening in the Market

  • Closed median price at an all-time high of $736,500, up 20% from a year ago.


  • Price appreciation is being driven by low supply and high demand.  Eastside month’s supply of inventory is less than three weeks (0.7 months), the lowest ever.


  • 737 active listings as of 3/31/17.  Down 21% from last year and 42% from the year before.


  • Scarcity has buyers paying above list price on 61% of the sales that closed in March.


  • What was the cost of waiting on year (March 2016 vs March 2017) to buy?  $120,400 more in median price. Interest rates up .51%.  $769 a month more for the same home.

Home BuyingWindermere Bellevue Commons News April 5, 2017

Buying a Home this Spring? Be Prepared for Bidding Wars

Buying this Spring? Be Prepared for Bidding Wars | MyKCM

Traditionally, spring is the busiest season for real estate. Buyers come out in force and homeowners list their houses for sale hoping to capitalize on buyer activity. This year will be no different!

Buyers have already been out in force looking for their dream homes and more are on their way, but the challenge is that the inventory of homes for sale has not kept up with demand, which has lead to A LOT of competition for the homes that are available.

A recent Bloomberg article touched on the current market conditions:

“It’s the 2017 U.S. spring home-selling season, and listings are scarcer than they’ve ever been. Bidding wars common in perennially hot markets like the San Francisco Bay area, Denver and Boston are now also prevalent in the once slow-and-steady heartland, sending prices higher and sparking desperation among buyers across the country.”

Sam Khater, Deputy Chief Economist at CoreLogic went on to explain why buyers are flocking to the market in big numbers:

“In today’s market, many buyers think the trough in [interest] rates is over. If you don’t get in now, it’s just going to be worse later. Rates will be higher, prices will be higher, and maybe inventory selection will be lower.”

In some markets, “thirty-five percent of properties are selling within the first week or two of hitting the market.” Homes are selling at a rapid clip in places like:

  • Denver, CO
  • Seattle, WA
  • Oakland, CA
  • Grand Rapids, MI
  • Boise, ID
  • Madison, WI
  • Omaha, NE
Source: keepingcurrentmatters.com

Market StatsWindermere Bellevue Commons News March 9, 2017

King & Snohomish County Market Stats – February 2017

What’s Happening in the Market

Home sales continue to be slightly above last year’s totals in the areas tracked in this report.  We are continuing to see double digit price increases spread out from the core of Bellevue and Seattle due to the somewhat exorbitant prices now demanded from the metro area Sellers.

Low Inventory

Inventory hit an all-time low in February which at last count was 3 weeks of inventory if nothing new came on the market.  (That’s weeks, not months!) We do expect to see an increase in listings in March and April, but Sellers are still wary of putting their home on the market with nowhere to go. Buyers and Buyers agents are having to be creative with their offers as we are seeing at least 50% of the sales occurring are done in multiple offer situations. We don’t expect this to change anytime soon!

Market Stats February 1, 2017

How Much Did Residential Home Prices Rise in 2016?

King County Residential Home Price-Increase in 2016

King County Residential home prices increased an average of 12.7%. Here is the list of median home price-increase in different areas.

Shoreline/Richmond Beach $439,725–> $503,393
Lake Forest Park $432,250–> $505,350
Ballard $587,000–> $655,000
North Seattle $575,000–> $679,950
Queen Anne/Magnolia $780,500–> $882,500
Central Seattle $689,999–> $774,995
SODO/Beacon Hill $420,000–> $501,975
West Seattle $450,000–> $511,500
Southeast Seattle $441,500–> $500,000
Kirkland/Rosehill $801,000–> $899,500
Redmond $650,000–> $709,793
West Bellevue $1,751,000–> $1,948,000
East Bellevue $638,950–> $730,000
East Lake Sammamish $645,000–> $736,001
South Bellevue/Newcastle $713,000–> $788,888
Mercer Island $1,195,000–> $1,315,000
Juanita/Woodinville/Bothell/Duvall $525,000–> $610,000


All data compiled from information supplied by Northwest Multiple Listing Association on 1/01/2017 Accuracy of information herein is not guaranteed.
This information was only taken of single-family homes, and does not include condominiums or vacant land.

Market Stats January 26, 2017

First Time Buyers, Millennials, and What to Expect in 2017

2017 Economic and Housing Forecast

I believe that the big story for the coming year will be first-time home buyers. Since they don’t need to sell before purchasing, their reemergence into the market ensures that sales will continue to increase, even while inventory is limited. Thirty-one percent of buyers currently in the real estate market are first-time buyers, but it would be more ideal if that figure was closer to 40 percent.

Why don’t we have enough first-time buyers in the market? With Baby Boomers working and living longer, we aren’t making much room for Millennials to start their careers. Plus, the major debt that the younger generation owes on student loans ($1.3 trillion today) hugely impacts the housing market. But the bigger issue is lack of down payments. Before the recession, many Millennials could look to their parents for help with down payments; however, these days that is not as much the case.

I would also contend that the notion of Millennials being a “renter generation” is nonsense. In a National Association of Realtors survey, 75 percent of them said that buying a home would be the most astute financial decision they’d ever make; however, 80 percent said they don’t think they could qualify for a mortgage. I do believe that Millennials will eventually buy, but they’re delaying their purchasing decisions by about three years when compared to previous generations, which is about the same amount of time they’re waiting to start families as well.

Mortgage rates have risen rapidly since the election, and unfortunately, I do not see a turnaround in this trend. That said, they will remain cheap when compared to historic averages.  Expect to see the yield on 30-year mortgages rise to around 4.7% by the end of 2017. For those who have grown accustomed to interest rates being at historic lows, this might seem high, but it’s all relative.

If I were to gaze all the way into 2018, my crystal ball takes me to the dreaded “R” word. Like taxes and death, recessions are another one of those unwanted realities that inevitably comes to visit every so often. Irrespective of who was voted into the White House, my view remains the same: prepare to see a business cycle recession by the end of 2018, but, rest assured, it will not be driven by real estate, nor will it resemble the Great Recession in any way.

This article was first posted in Windermere.com by  Matthew Gardner, Chief Economist, Windermere Real Estate
Market Stats January 25, 2017

Western Washington Real Estate Market Update

OVERVIEW of  Western Washington Real Estate Market

Here is a detailed overview of Western Washington Real Estate Market. Washington State finished the year on a high with jobs continuing to be added across the market. Additionally, we are seeing decent growth in the area’s smaller markets, which have not benefited from the same robust growth as the larger metropolitan markets.

Unemployment rates throughout the region continue to drop and the levels in the central Puget Sound region suggest that we are at full employment. In the coming year, I anticipate that we will see substantial income growth as companies look to recruit new talent and keep existing employees happy.


HOME SALES ACTIVITY

  • There were 19,745 home sales during the fourth quarter of 2016—up by a very impressive 13.4% from the same period in 2015, but 18.7% below the total number of sales seen in the third quarter of the year. (This is a function of seasonality and no cause for concern.)
  • Sales in Clallam County grew at the fastest rate over the past 12 months, with home sales up by 47%. There were also impressive sales increases in Grays Harbor and Thurston Counties. Jefferson County had a fairly modest decrease in sales.
  • The number of available listings continues to remain well below historic averages. The total number of homes for sale in the fourth quarter was down by 13.7% compared to the same period a year ago.
  • The key takeaway from this data is that 2017 will continue to be a seller’s market. We should see some improvement in listing activity, but it is highly likely that demand will exceed supply for another year.

HOME PRICES

  • Demand continued to exceed supply in the final three months of 2016 and this caused home prices to continue to rise. In the fourth quarter, average prices rose by 7.1% but were 0.4% higher than the third quarter of the year. The region’s average sales price is now $414,110.
  • In most parts of the region, home prices are well above historic highs and continue to trend upward.
  • When compared to the fourth quarter of 2015, price growth was most pronounced in Kittitas County. In total, there were eight counties where annual price growth exceeded 10%. We saw a drop in sales prices in the notoriously volatile San Juan County.
  • The aggressive home price growth that we’ve experienced in recent years should start to taper in 2017, but prices will continue to increase at rates that are higher than historic averages.


DAYS ON MARKET

  • The average number of days it took to sell a home in the fourth quarter dropped by 15 days when compared to the fourth quarter of 2015.
  • King County was the only area where it took less than a month to sell a home, but all markets saw decent improvement in the time it took to sell a home when compared to a year ago.
  • In the final quarter of the year, it took an average of 64 days to sell a home. This is down from the 78 days it took in the third quarter of 2015, but up from the 52 days it took in the third quarter of 2016. (This is due to seasonality and not a cause for concern.)
  • We may experience a modest increase in the time it takes to sell a home in 2017, but only if there is a rapid increase in listings, which is certainly not a given.

CONCLUSIONS

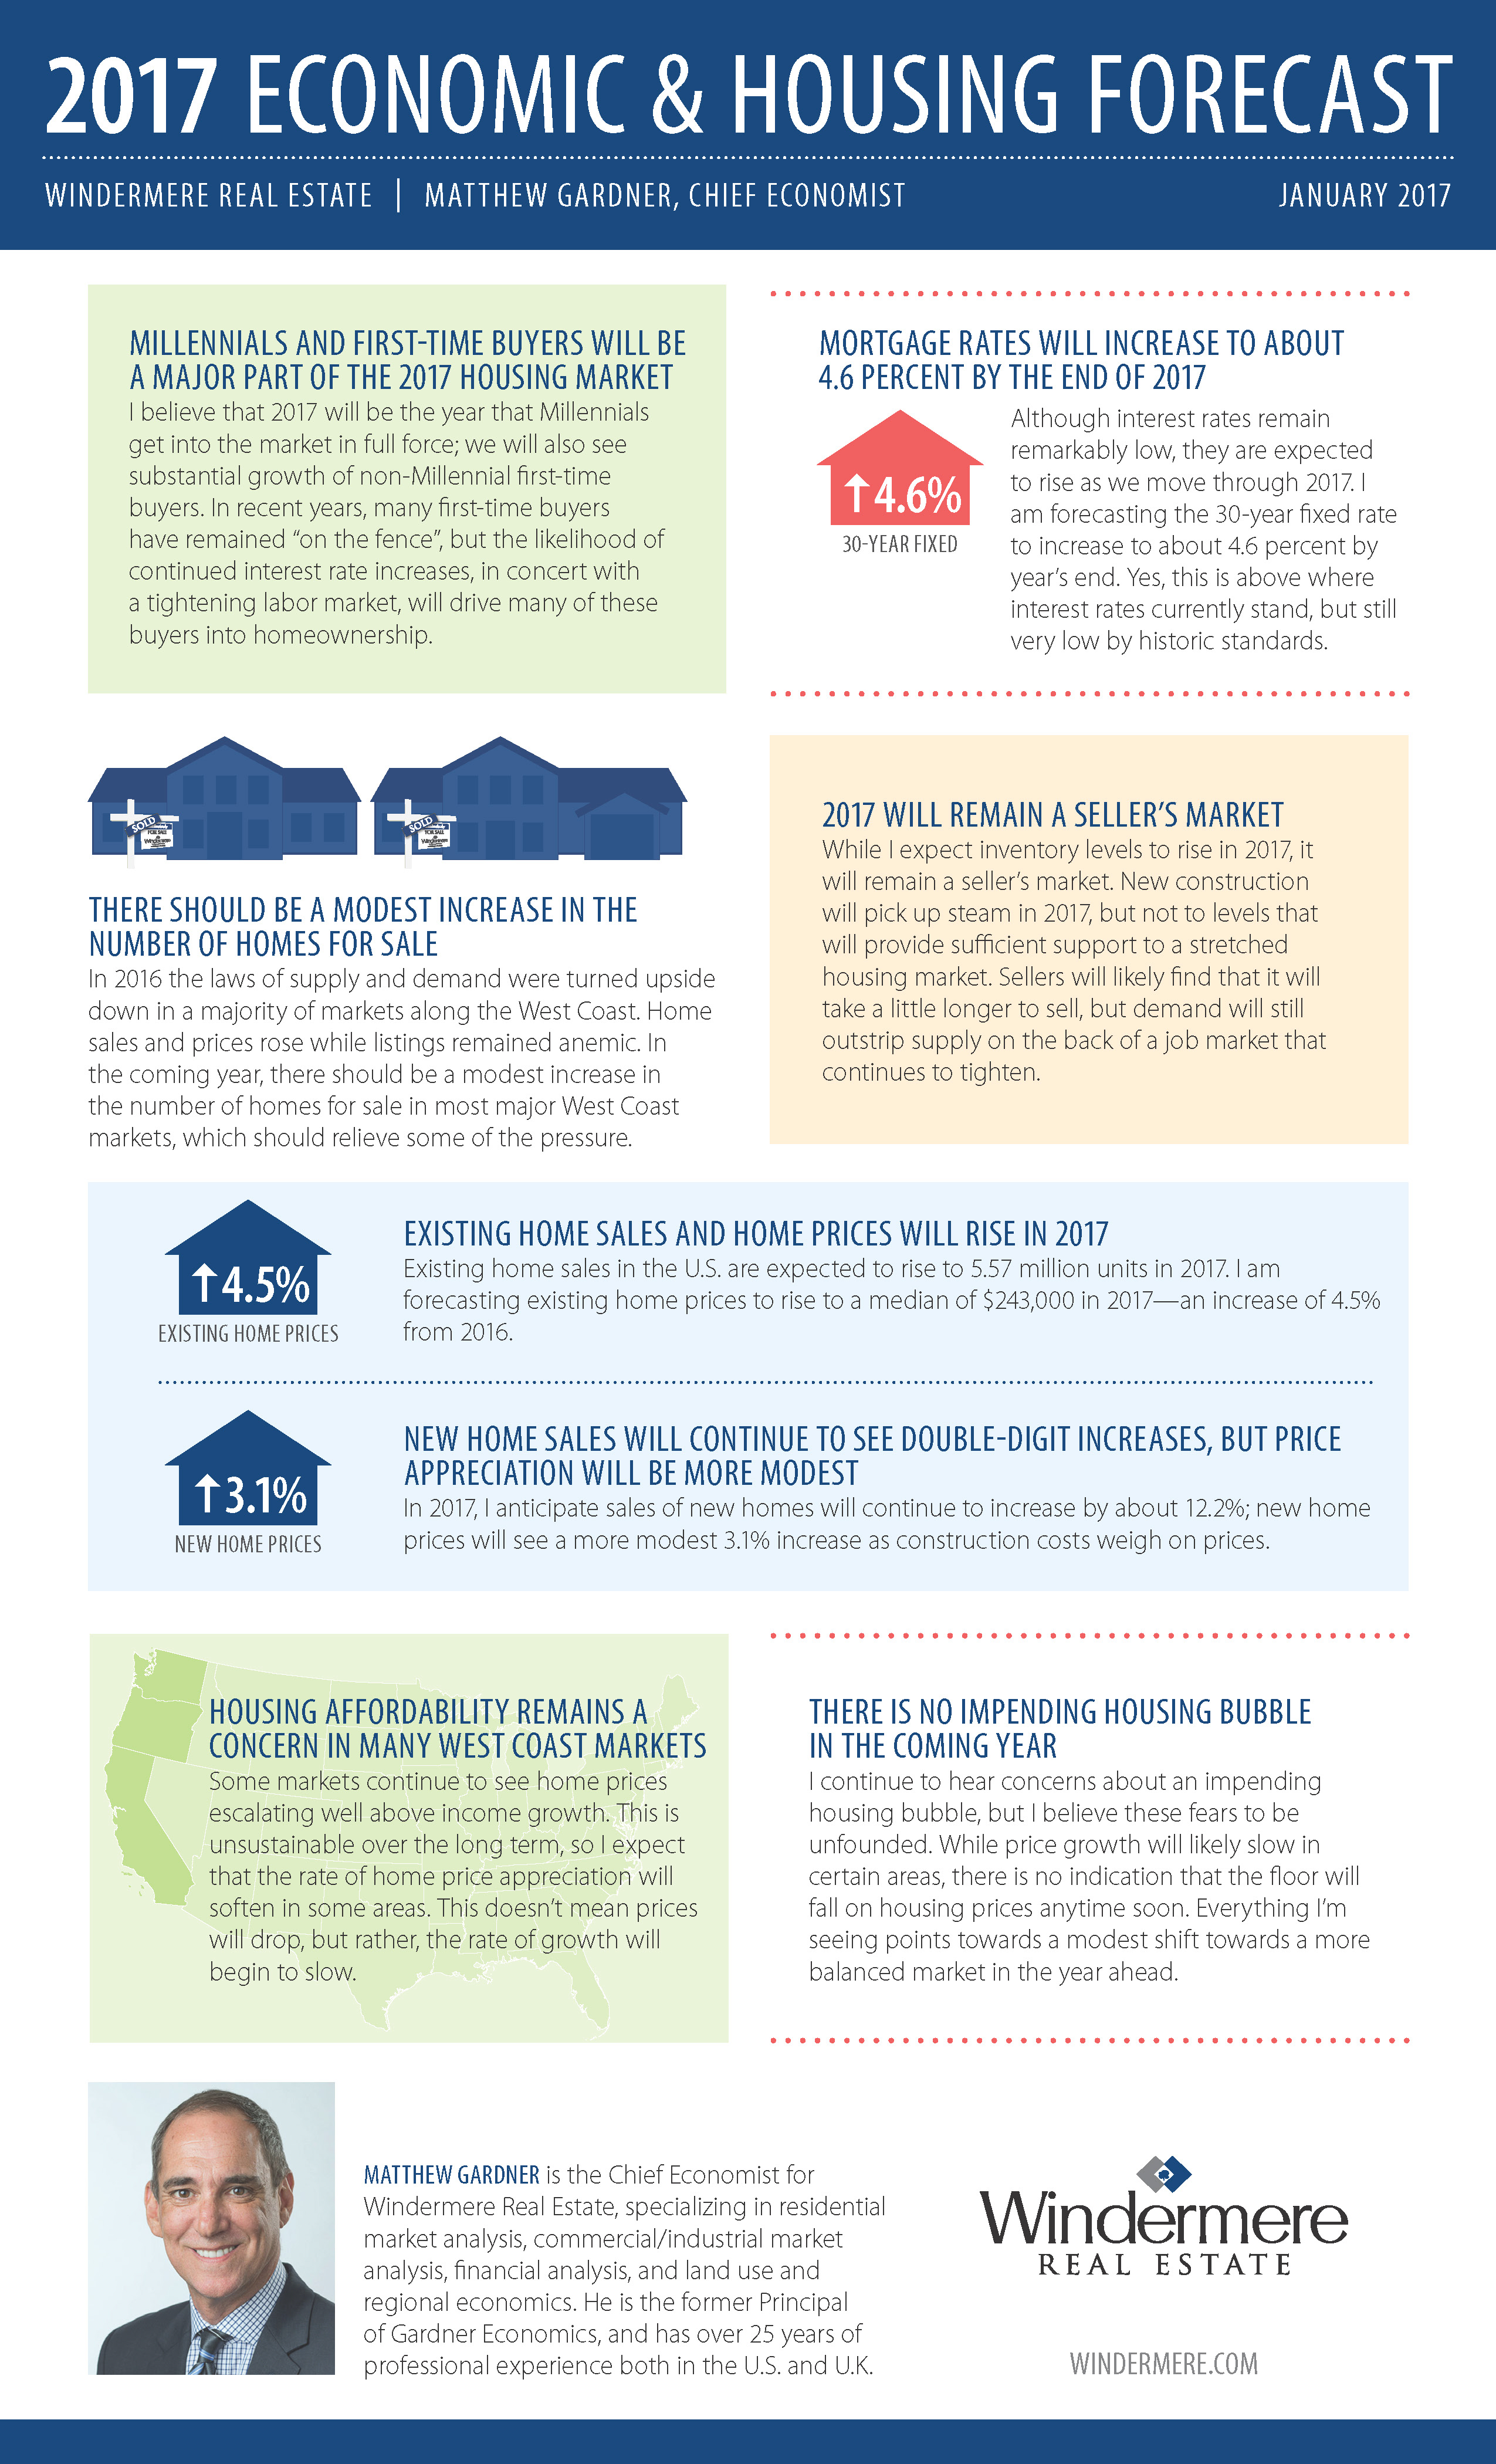
This speedometer reflects the state of the region’s housing market using housing inventory, price gains, sales velocities, interest rates, and larger economic factors. For the fourth quarter of 2016, I actually moved the needle a little more in favor of buyers, but this is purely a function of the increase in interest rates that was seen after the election. Higher borrowing costs mean that buyers can afford less, which could ultimately put some modest downward pressure on home prices in 2017. That said, the region will still strongly favor sellers in the coming year.


This article were first Posted on windermere.com by Matthew Gardner, Chief Economist, Windermere Real Estate