
 Facebook
 X
X
 Pinterest
 Copy Link
Local Market Update November 2019
A steady influx of buyers continued to strain already tight inventory throughout the area in October. Home sales were up, as were prices in much of the region. With our thriving economy and highly desirable quality of life drawing ever more people here, the supply of homes isn’t close to meeting demand. Homeowners thinking about putting their property on the market can expect strong buyer interest.
EASTSIDE
As the Eastside continues to rack up “best places” awards, it’s no surprise that the area is booming. Development is on the rise, fueled primarily by the tech sector. The appeal of the Eastside has kept home prices here the highest of any segment of King County. The median single-family home price in October was stable as compared to the same time last year, rising 1% to $900,000.

KING COUNTY
King County’s 1.74 months of available inventory is far below the national average of four months. Despite the slim selection, demand in October was strong. The number of closed sales was up 5% and the number of pending sales (offers accepted but not yet closed) was up 11%. The median price of a single-family home was down 2% over a year ago to $660,000. However, some areas around the more reasonably-priced south end of the county saw double-digit price increases.

SEATTLE
Seattle home prices took their largest year-over-year jump in 12 months. The median price of a single-family home sold in October was up 3% from a year ago to $775,000, a $25,000 increase from September of this year. Seattle was recently named the third fastest-growing city in America. Real estate investment is surging. A growing population and booming economy continue to keep demand for housing –and home prices—strong.

SNOHOMISH COUNTY
Both the number of home sales and home prices were on the rise in Snohomish County in October. Overall homes sales increased 7%, and the median price of a single-family home rose 5% over a year ago to $495,000. Supply remains very low, with just six weeks of available inventory.

VIEW FULL SNOHOMISH COUNTY REPORT
This post originally appeared on GetTheWReport.com
Local Market Update August 2019
The real estate market continued to moderate in July. Inventory rose and home values softened, providing buyers with increased selection and more favorable pricing. With strong job growth and interest rates holding at below 4 percent, brokers expect the market to remain solid through fall.
EASTSIDE
The market remains strong on the Eastside. The current tech boom continues to fuel demand, buoyed by Google’s recent plans to build out another office in Kirkland. An increase in inventory gives buyers more time to find the right home for their budget. The median price of a single-family home on the Eastside was $925,000 in July, down 2 percent from the same time last year.

KING COUNTY
Home prices in King County continued to ease. Buyers took advantage of lower prices and new inventory to boost home sales in July. The median price of a single-family home was $680,000, a 3 percent decline from the same time last year. More moderately-priced areas in the south end of the county saw continued price growth.

SEATTLE
It’s no surprise that Seattle is the top city in the country where millennials are moving. Apple plans to add 2,000 jobs in Seattle. The first of 4,500 Expedia employees will start moving into Interbay soon. While demand here is expected to stay strong, prices continue to cool. The median price of a single-family home was $755,000, down 6 percent from a year ago and a decrease of 3 percent from June. Southeast Seattle, which generally has more affordable homes, saw the median home price rise 9 percent over the same time last year.

SNOHOMISH COUNTY
Inventory remains very tight in Snohomish County. The number of listings on the market were up 6 percent over last year, and the county has only six weeks of available supply – far short of the four to six months that is considered balanced. The median price of a single-family home in July was $502,000 – up slightly from the median of $495,000 a year ago.
 VIEW FULL SNOHOMISH COUNTY REPORT
This post originally appeared on GetTheWReport.com
Eastside Market Update December 2018

The real estate market continued to improve for buyers in November. Interest rates dropped slightly, price increases slowed and inventory soared. It’s important to note that inventory increases, while significant, are being compared to the record low supply of last year. We’re still far short of the inventory needed for a truly balanced market, however buyers have greater choice and less competition than they’ve had in years. Sellers who price their home according to current market conditions continue to see strong interest. Heading into the holiday season, there’s something for everyone to celebrate.
Eastside, King County, Seattle, and Snohomish Market Stats Update December 2018

The real estate market continued to improve for buyers in November. Interest rates dropped slightly, price increases slowed and inventory soared. It’s important to note that inventory increases, while significant, are being compared to the record low supply of last year. We’re still far short of the inventory needed for a truly balanced market, however buyers have greater choice and less competition than they’ve had in years. Sellers who price their home according to current market conditions continue to see strong interest. Heading into the holiday season, there’s something for everyone to celebrate.
Eastside
 >>>Click image to view full report.
The Eastside economy continues to be very strong. Heavy investment in commercial construction from companies such as Vulcan boost expectations that the area will continue to thrive. The median price of a single-family home in November hit $885,000 on the Eastside. Although an increase of 4 percent from a year ago, home prices have remained steady since this fall. With continued demand and only 2.4 months of inventory, the market has a long way to go to becoming balanced.
King County
 >>>Click image to view full report.
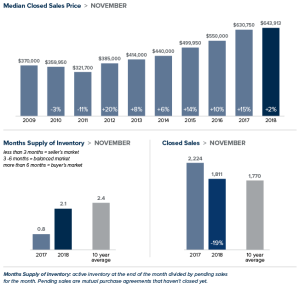
Price increases continued to slow in King County. The median single-family home price was $643,913 in November, an increase of 2 percent over a year ago. South King County, where the most affordable homes in the county are located, saw significantly greater increases compared to a year ago. North King County also posted greater increases than the county overall. Inventory has skyrocketed as the number of homes for sale in King County more than doubled year-over-year. While that’s good news for buyers, there is only 2.1 months of available inventory in the county, slightly down from October and not nearly enough to meet demand.
Seattle
 >>>Click image to view full report.
The median price of a single-family home in Seattle was $760,000 in November. This is up 3 percent from a year ago and slightly up from October. Inventory jumped 177 percent year-over-year however, at just two months of supply, the Seattle area has the tightest inventory in King County. With the city’s strong economy and lifestyle appeal, that’s not expected to change any time soon. Forbes recently named Seattle as the best place for business and careers in the nation. U.S. News & World Report ranked the University of Washington among the top ten universities in the world with Money Magazine rating Seattle the #5 Best Big City to Live In.
Snohomish County
 >>>Click image to view full report.
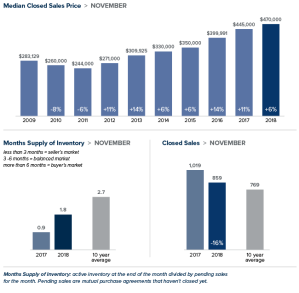
Inventory in Snohomish County continued to climb, surging 88 percent in November as compared to a year ago. That said, the area has fewer homes for sale than King County with just 1.8 months of inventory. This is still far short of the four to six months of supply that is considered a balanced market. The median price of a single-family home sold in November was up 6 percent from last year to $470,000, virtually unchanged from October.
This post originally appeared on the WindermereEastside.com blog.
The Gardner Report – First Quarter 2018

Western Washington Real Estate Market Update

The following analysis of the Western Washington real estate market is provided by Windermere Real Estate Chief Economist Matthew Gardner. We hope that this information may assist you with making better-informed real estate decisions. For further information about the housing market in your area, please don’t hesitate to contact me.
ECONOMIC OVERVIEW
The Washington State economy added 96,900 new jobs over the past 12 months, representing an annual growth rate of 2.9%—still solidly above the national rate of 1.5%. Most of the employment gains were in the private sector, which rose by 3.4%. The public sector saw a more modest increase of 1.6%.
The strongest growth was in the Education & Health Services and Retail sectors, which added 17,300 and 16,700 jobs, respectively. The Construction sector added 10,900 new positions over the past 12 months.
Even with solid increases in jobs, the state unemployment rate held steady at 4.7%—a figure that has not moved since September of last year.
I expect the Washington State economy to continue adding jobs in 2018, but not at the same rate as last year given that we are nearing full employment. That said, we will still outperform the nation as a whole when it comes to job creation.
HOME SALES ACTIVITY
- There were 14,961 home sales during the first quarter of 2018. This is a drop of 5.4% over the same period in 2017.
- Clallam County saw sales rise the fastest relative to the first quarter of 2017, with an increase of 16.5%. In most of the other markets, the lack of available homes for sale slowed the number of closings during this period.
- Listing inventory in the quarter was down by 17.6% when compared to the first quarter of 2017, but pending home sales rose by 2.6% over the same period, suggesting that closings in the second quarter should be fairly robust.
- The takeaway from this data is that the lack of supply continues to put a damper on sales. I also believe that the rise in interest rates in the finalquarter of 2017 likely pulled sales forward, leading to a drop in sales in the first quarter of 2018.

HOME PRICES

- With ongoing limited inventory, it’s not surprising that the growth in home prices continues to trend well above the long-term average. Year-over-year, average prices rose 14.4% to $468,312.
- Economic vitality in the region is leading to robust housing demand that far exceeds supply. Given the relative lack of new construction homes— something that is unlikely to change any time soon—there will continue to be pressure on the resale market. As a result, home prices will continue to rise at above-average rates in the coming year.
- When compared to the same period a year ago, price growth was strongest in Grays Harbor County at 27.5%. Ten additional counties experienced double-digit price growth.
- Mortgage rates continued to rise during first quarter, and are expected to increase modestly in the coming months. By the end of the year, interest rates will likely land around 4.9%, which should take some of the steam out of price growth. This is actually a good thing and should help address the challenges we face with housing affordability—especially in markets near the major job centers.

DAYS ON MARKET
- The average number of days it took to sell a home dropped by seven days when compared to the same quarter of 2017.
- King County continues to be the tightest market in Western Washington, with homes taking an average of 24 days to sell. Every county in the region saw the length of time it took to sell a home either drop or remain essentially static relative to the same period a year ago.
- In looking at the entire region, it took an average of 61 days to sell a home in the first quarter of this year. This is down from 68 days in the firstquarter of 2017 but up by eleven days when compared to the fourth quarter of 2017.
- Anyone expecting to see a rapid rise in the number of homes for sale in 2018 will likely be disappointed. New construction permit activity—a leading indicator—remains well below historic levels and this will continue to put increasing pressure on the resale home market.

CONCLUSIONS

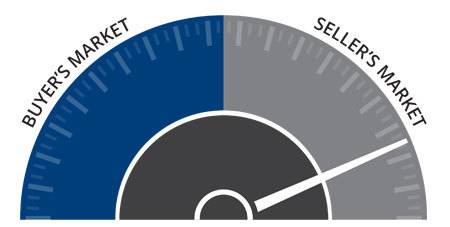
This speedometer reflects the state of the region’s housing market using housing inventory, price gains, home sales, interest rates, and larger economic factors. For the first quarter of 2018, I have left the needle at the same point as fourth quarter of last year. Price growth remains strong even as sales activity slowed. All things being equal, 2018 is setting itself up to be another very good year for sellers but, unfortunately, not for buyers who will still see stiff competition for the limited number of available homes for sale.

Mr. Gardner is the Chief Economist for Windermere Real Estate, specializing in residential market analysis, commercial/industrial market analysis, financial analysis, and land use and regional economics. He is the former Principal of Gardner Economics, and has more than 30 years of professional experience both in the U.S. and U.K.
Greater Seattle Area Real Estate Market – 3rd Quarter 2017
The Gardner Report – Third Quarter 2017

ECONOMIC OVERVIEW
The Washington State economy added 79,600 new jobs over the past 12 months—an impressive growth rate of 2.4%, and well above the national growth rate of 1.2%. However, as we anticipated in last quarter’s report, we continue to see a modest slowdown in the growth rate as the state grows closer to full employment. Growth has been broad-based, with expansion in all major job sectors other than Aerospace (a function of a slowdown at Boeing). Given the current rate of expansion, I am raising my employment forecast and now predict that Washington will add 81,000 new jobs in 2017.
Given the robust job market, it is unsurprising that the state unemployment rate continues to fall. The current unemployment rate in Washington State is 4.6% and we are essentially at full employment. Additionally, all counties contained within this report reported either a drop or stability in their unemployment rate from a year ago. I maintain my belief that the Washington State economy will continue to outperform the U.S. as a whole. Given such a strong expansion, we should also expect solid income growth across Western Washington.
HOME SALES ACTIVITY
- There were 25,312 home sales during the third quarter of 2017. This is an increase of 3.6% over the same period in 2016.
- Clallam County maintains its number one position for sales growth over the past 12 months. Only four other counties saw double-digit gains in sales. This demonstrates continuing issues with the low supply of listings. There were modest declines in sales activity in six counties.
- The market remains remarkably tight with listing inventory down by 14.2% when compared to the third quarter of 2016. But inventory is up a significant 32% compared to the second quarter of this year. Pending sales rose by 5.2% over the same quarter a year ago, which suggests that closings in Q4 will still be robust.
- The key takeaway from this data is that inventory is still very low, and the situation is unlikely to improve through the balance of the year.

HOME PRICES
 Given tight supply levels, it is unsurprising to see very solid price growth across the Western Washington counties. Year-over-year, average prices rose 12.3% to $474,184. This is 0.9% higher than seen in the second quarter of this year.
- With demand far exceeding supply, price growth in Western Washington continues to trend well above the longterm average. As I do not expect to see the new home market expand at any significant pace, there will be continued pressure on the resale market, which will cause home prices to continue to rise at above-average rates.
- When compared to the same period a year ago, price growth was most pronounced in Grays Harbor County where sale prices were 20.1% higher than the third quarter of 2016. Nine additional counties experienced double-digit price growth.
- Mortgage rates in the quarter continue to test the lows of 2017, and this is unlikely to change in the near-term. This will allow home prices to escalate further but I expect we will see rates start to rise fairly modestly in 2018, which could slow price growth.
 Given tight supply levels, it is unsurprising to see very solid price growth across the Western Washington counties. Year-over-year, average prices rose 12.3% to $474,184. This is 0.9% higher than seen in the second quarter of this year.

DAYS ON MARKET
- The average number of days it took to sell a home in the quarter dropped by eight days when compared to the same quarter of 2016.
- King County continues to be the tightest market, with homes taking an average of 17 days to sell. Every county except San Juan saw the days on market drop from the same period a year ago.
- This quarter, it took an average of 43 days to sell a home. This is down from the 51 days it took in the second quarter of 2016 and down by 8 days from the second quarter of this year.
- At some point, inventory will start to grow and this will lead to an increase in the average time it takes to sell a house. However, I do not expect that to happen at any time soon. So we remain in a seller’s market.

CONCLUSIONS
 This speedometer reflects the state of the region’s housing market using housing inventory, price gains, home sales, interest rates, and larger economic factors. For the third quarter of 2017, I have left the needle at the same point as the second quarter. Though price growth remains robust, sales activity has slowed very slightly and listings jumped relative to the second quarter. That said, the market is very strong and buyers will continue to find significant competition for accurately priced and well-located homes.
ABOUT MATTHEW GARDNER
 Matthew Gardner is the Chief Economist for Windermere Real Estate, specializing in residential market analysis, commercial/industrial market analysis, financial analysis, and land use and regional economics. He is the former Principal of Gardner Economics, and has more than 30 years of professional experience both in the U.S. and U.K.
King & Snohomish County Market Stats – August 2017
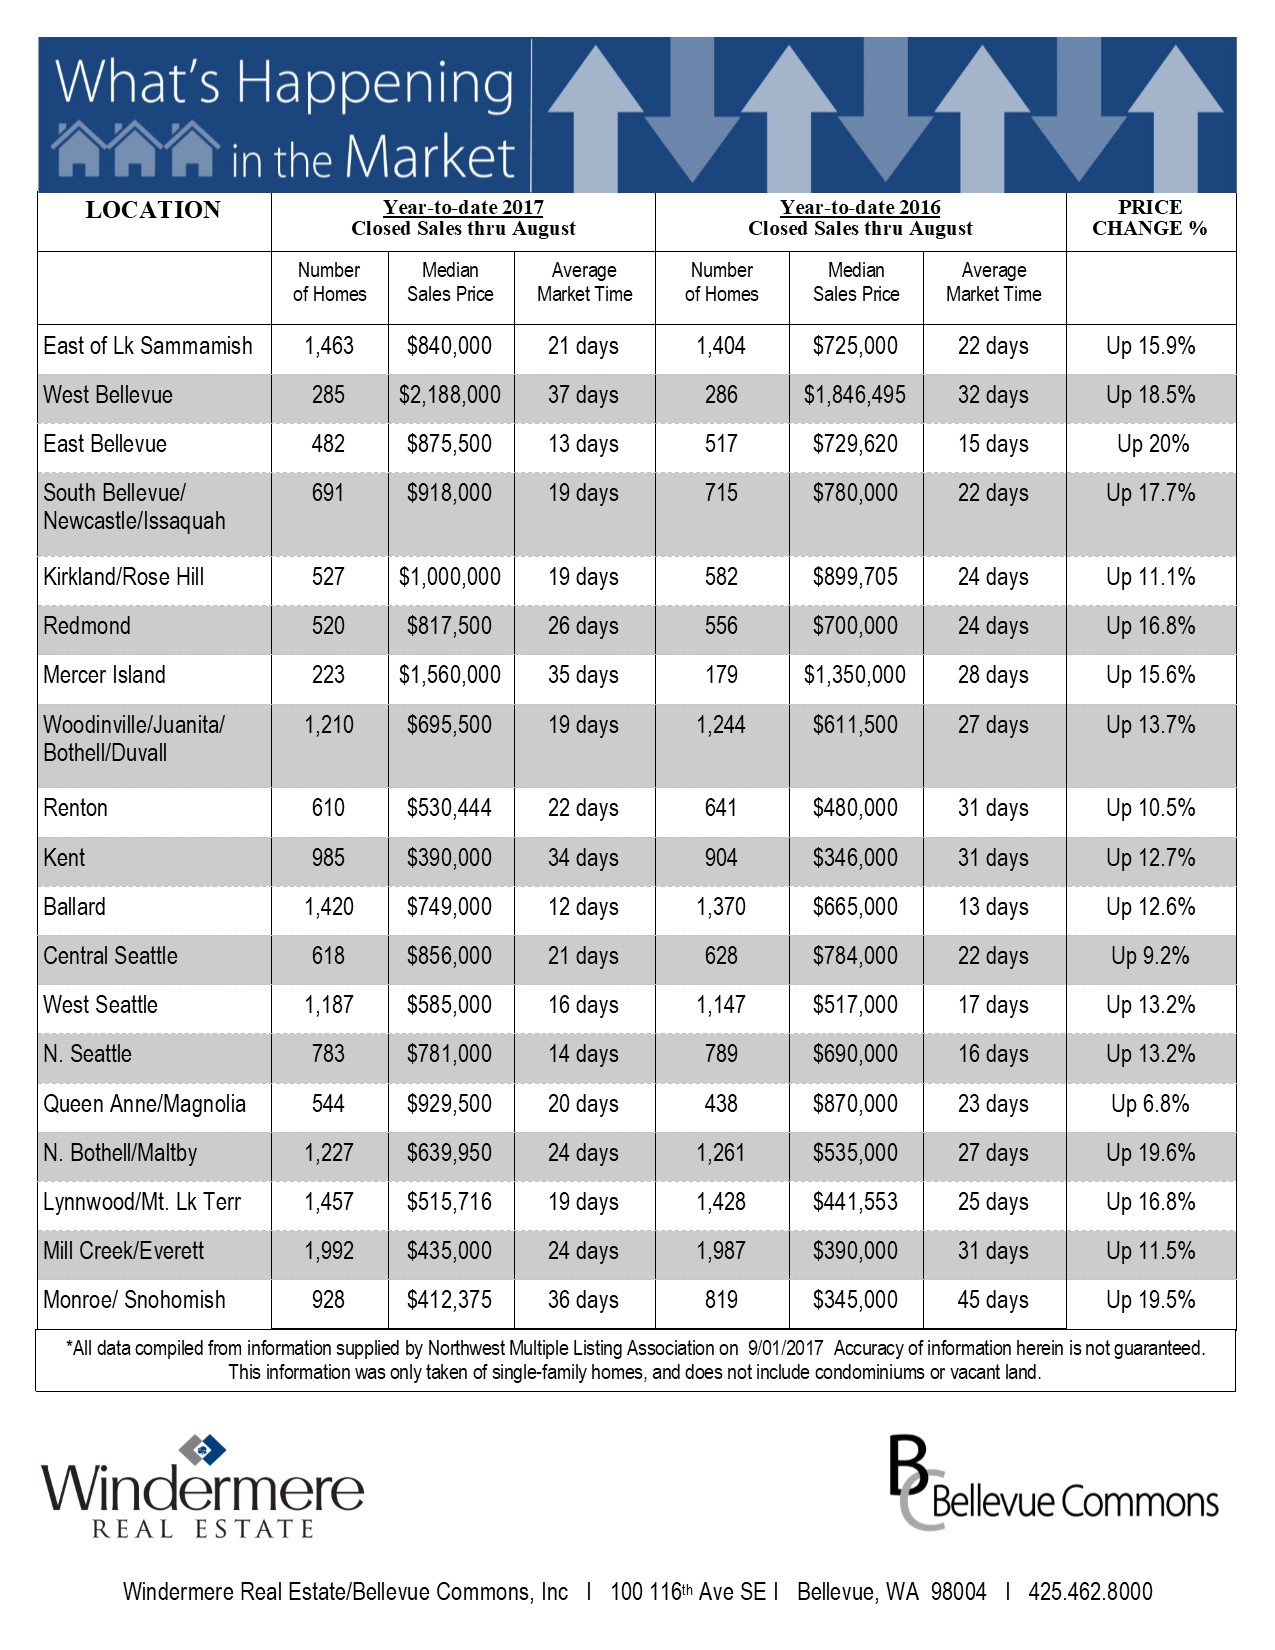
What’s Happening in the Market
Eastside (based on Residential Homes):
Low Inventory
The Real Estate market in August 2017 showed signs of slowing down, but it was interesting to see as home inventory fell, homes under $1.5M on the eastside were still selling at a fast pace while the upper end Buyers were being much pickier.
Less Sail-Fails
Another interesting thing to note was that Sale fails were continuing to drop which is a credit to more qualified Buyers and tighter contracts that are required when competing in a multiple offer situations. It also was because of the pre-inspections being done before writing offers instead of requiring Buyers to find deficiencies and then renegotiate the terms of the contract.

The Gardner Report – 2nd Quarter 2017

|
|||||||||||||||||||
|
|||||||||||||||||||
|
|||||||||||||||||||
|


King & Snohomish County Market Stats – May 2017
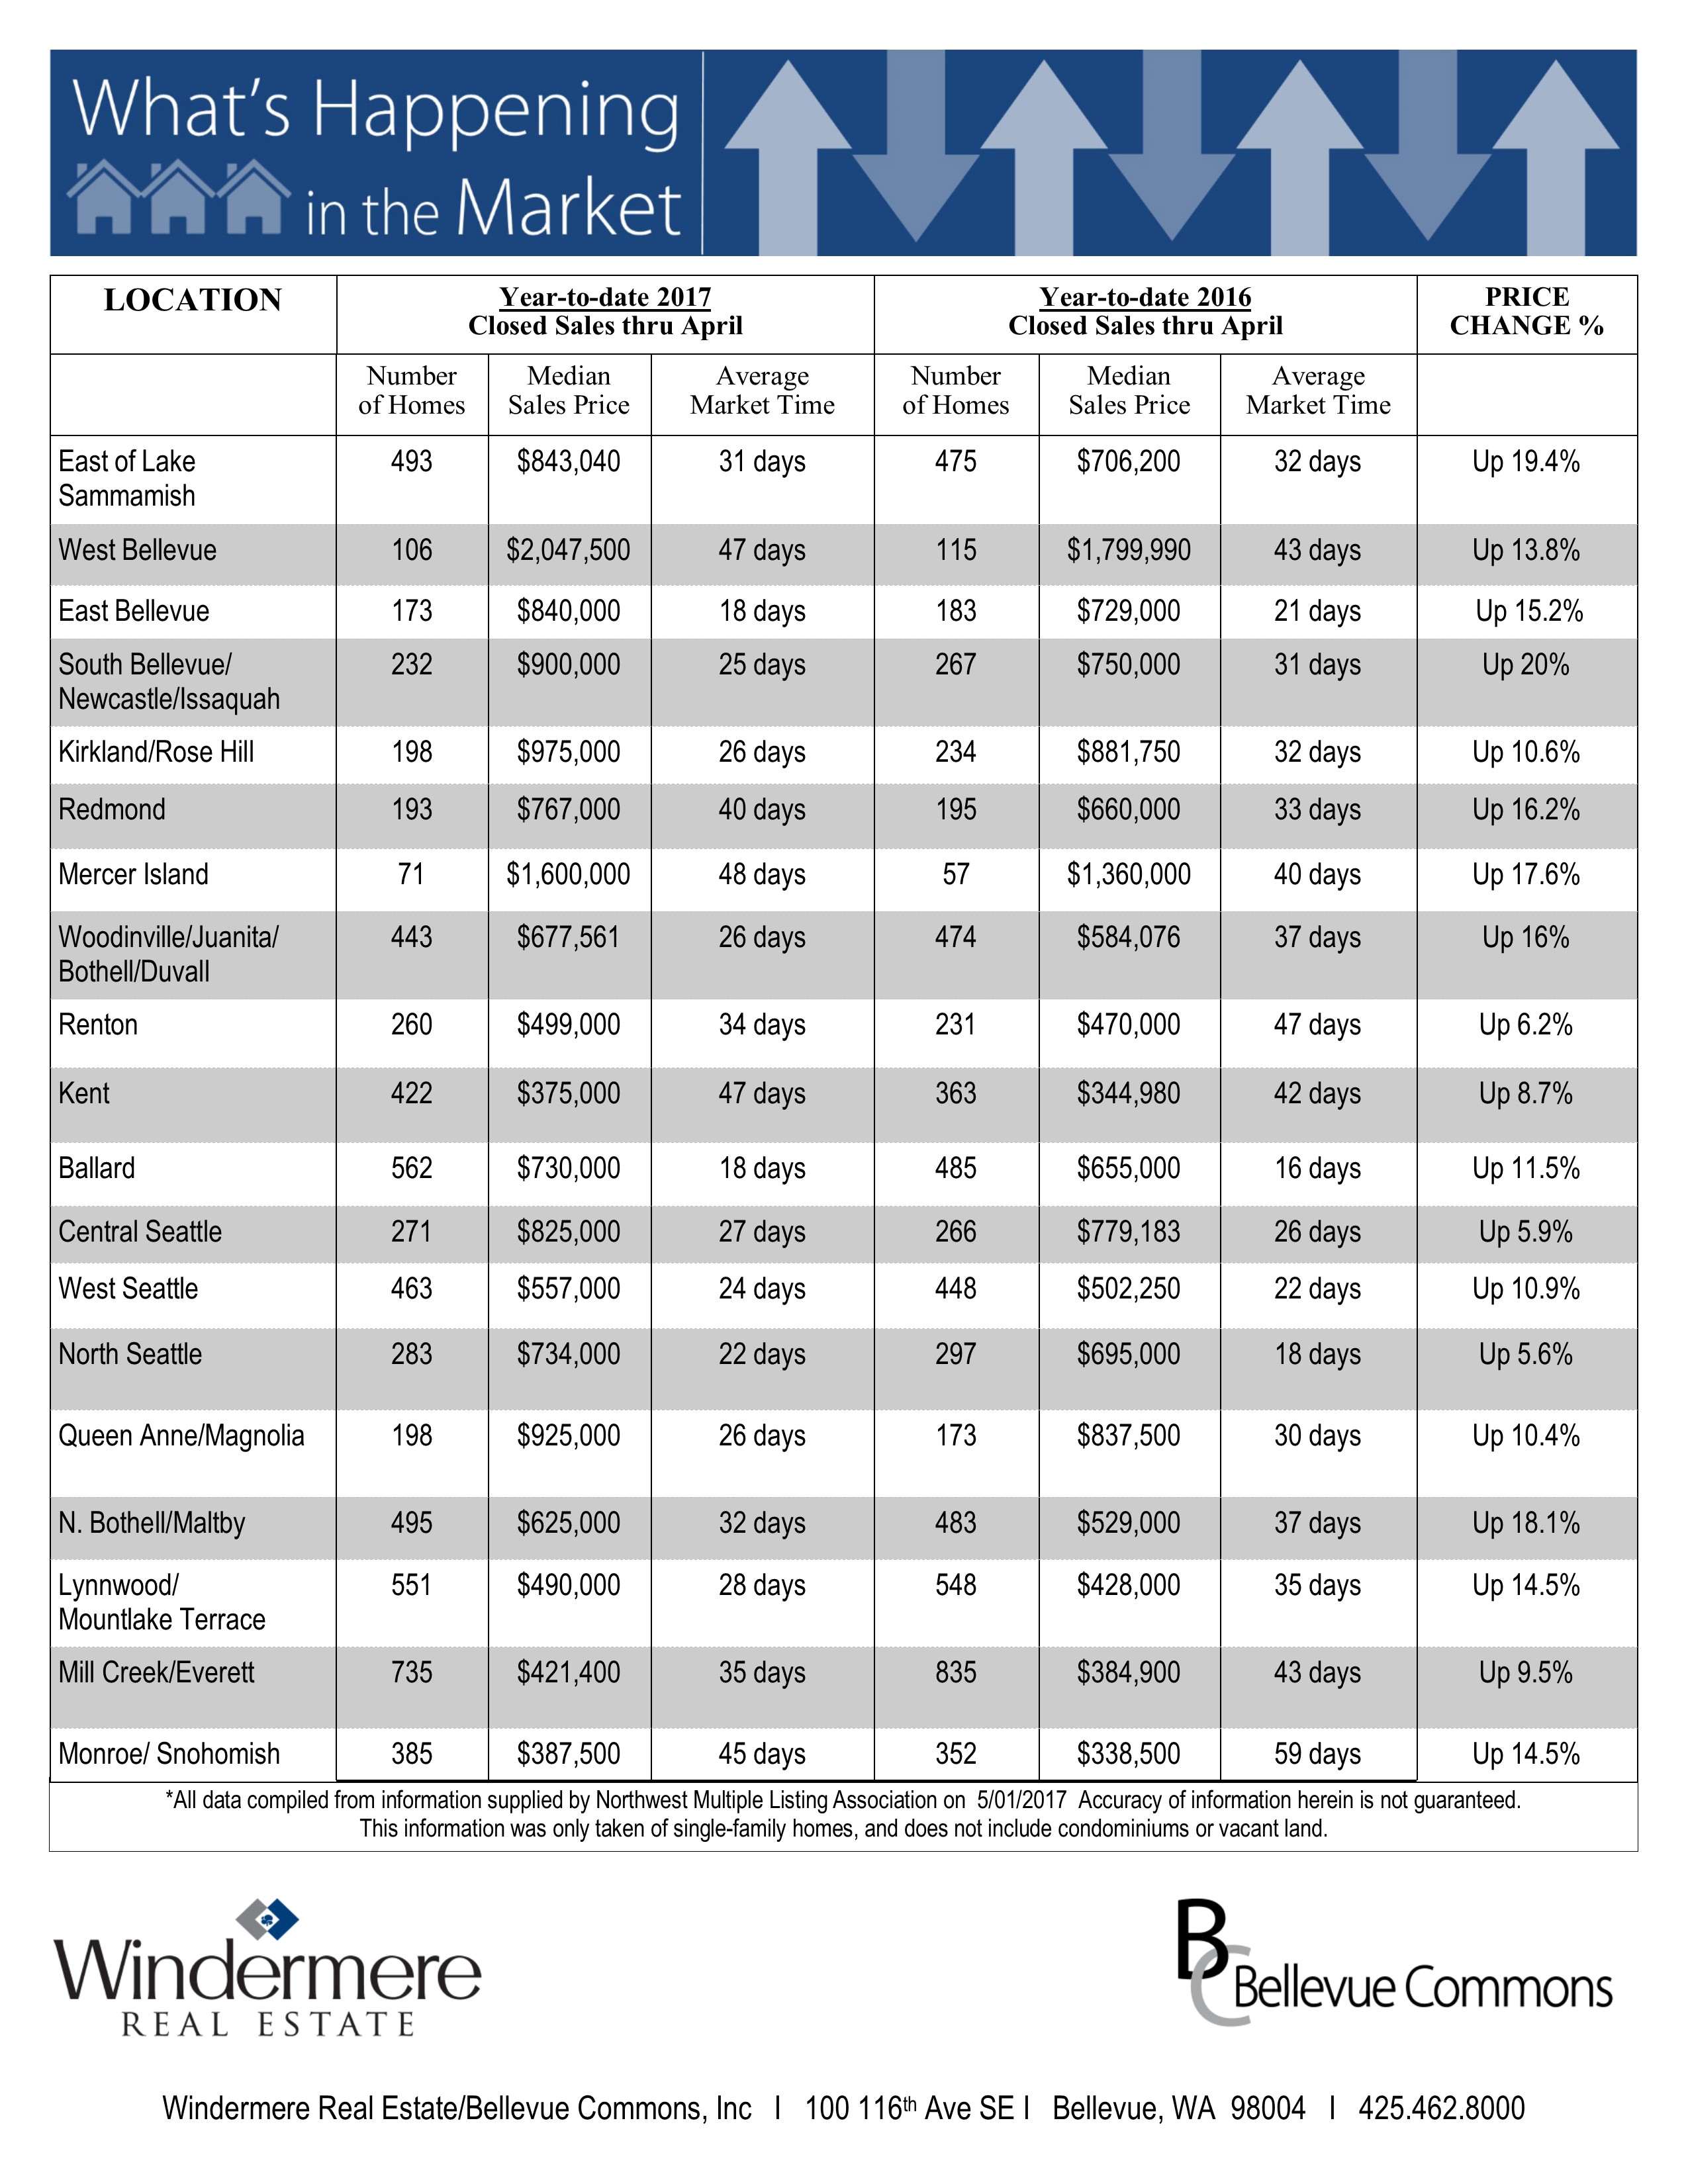
What’s Happening in the Market
Eastside (based on Residential and Condominium report):
- Closed median price at an all-time high of $748,944, up 20% from a year ago
- Price appreciation is being driven by low supply and high demand. Eastside months’ supply of inventory is less than three weeks, the lowest ever!
- 748 active listings as of 4/30/17. Down 33% from the year before and 48% from two years before.
- Scarcity has buyers paying above list price on 65% of the sales that closed in April.
- What was the cost of waiting on year (April 2016 vs April 2017) to buy? $123,944 in median price. $9,026 per year in payment.

King & Snohomish County Market Stats – March 2017
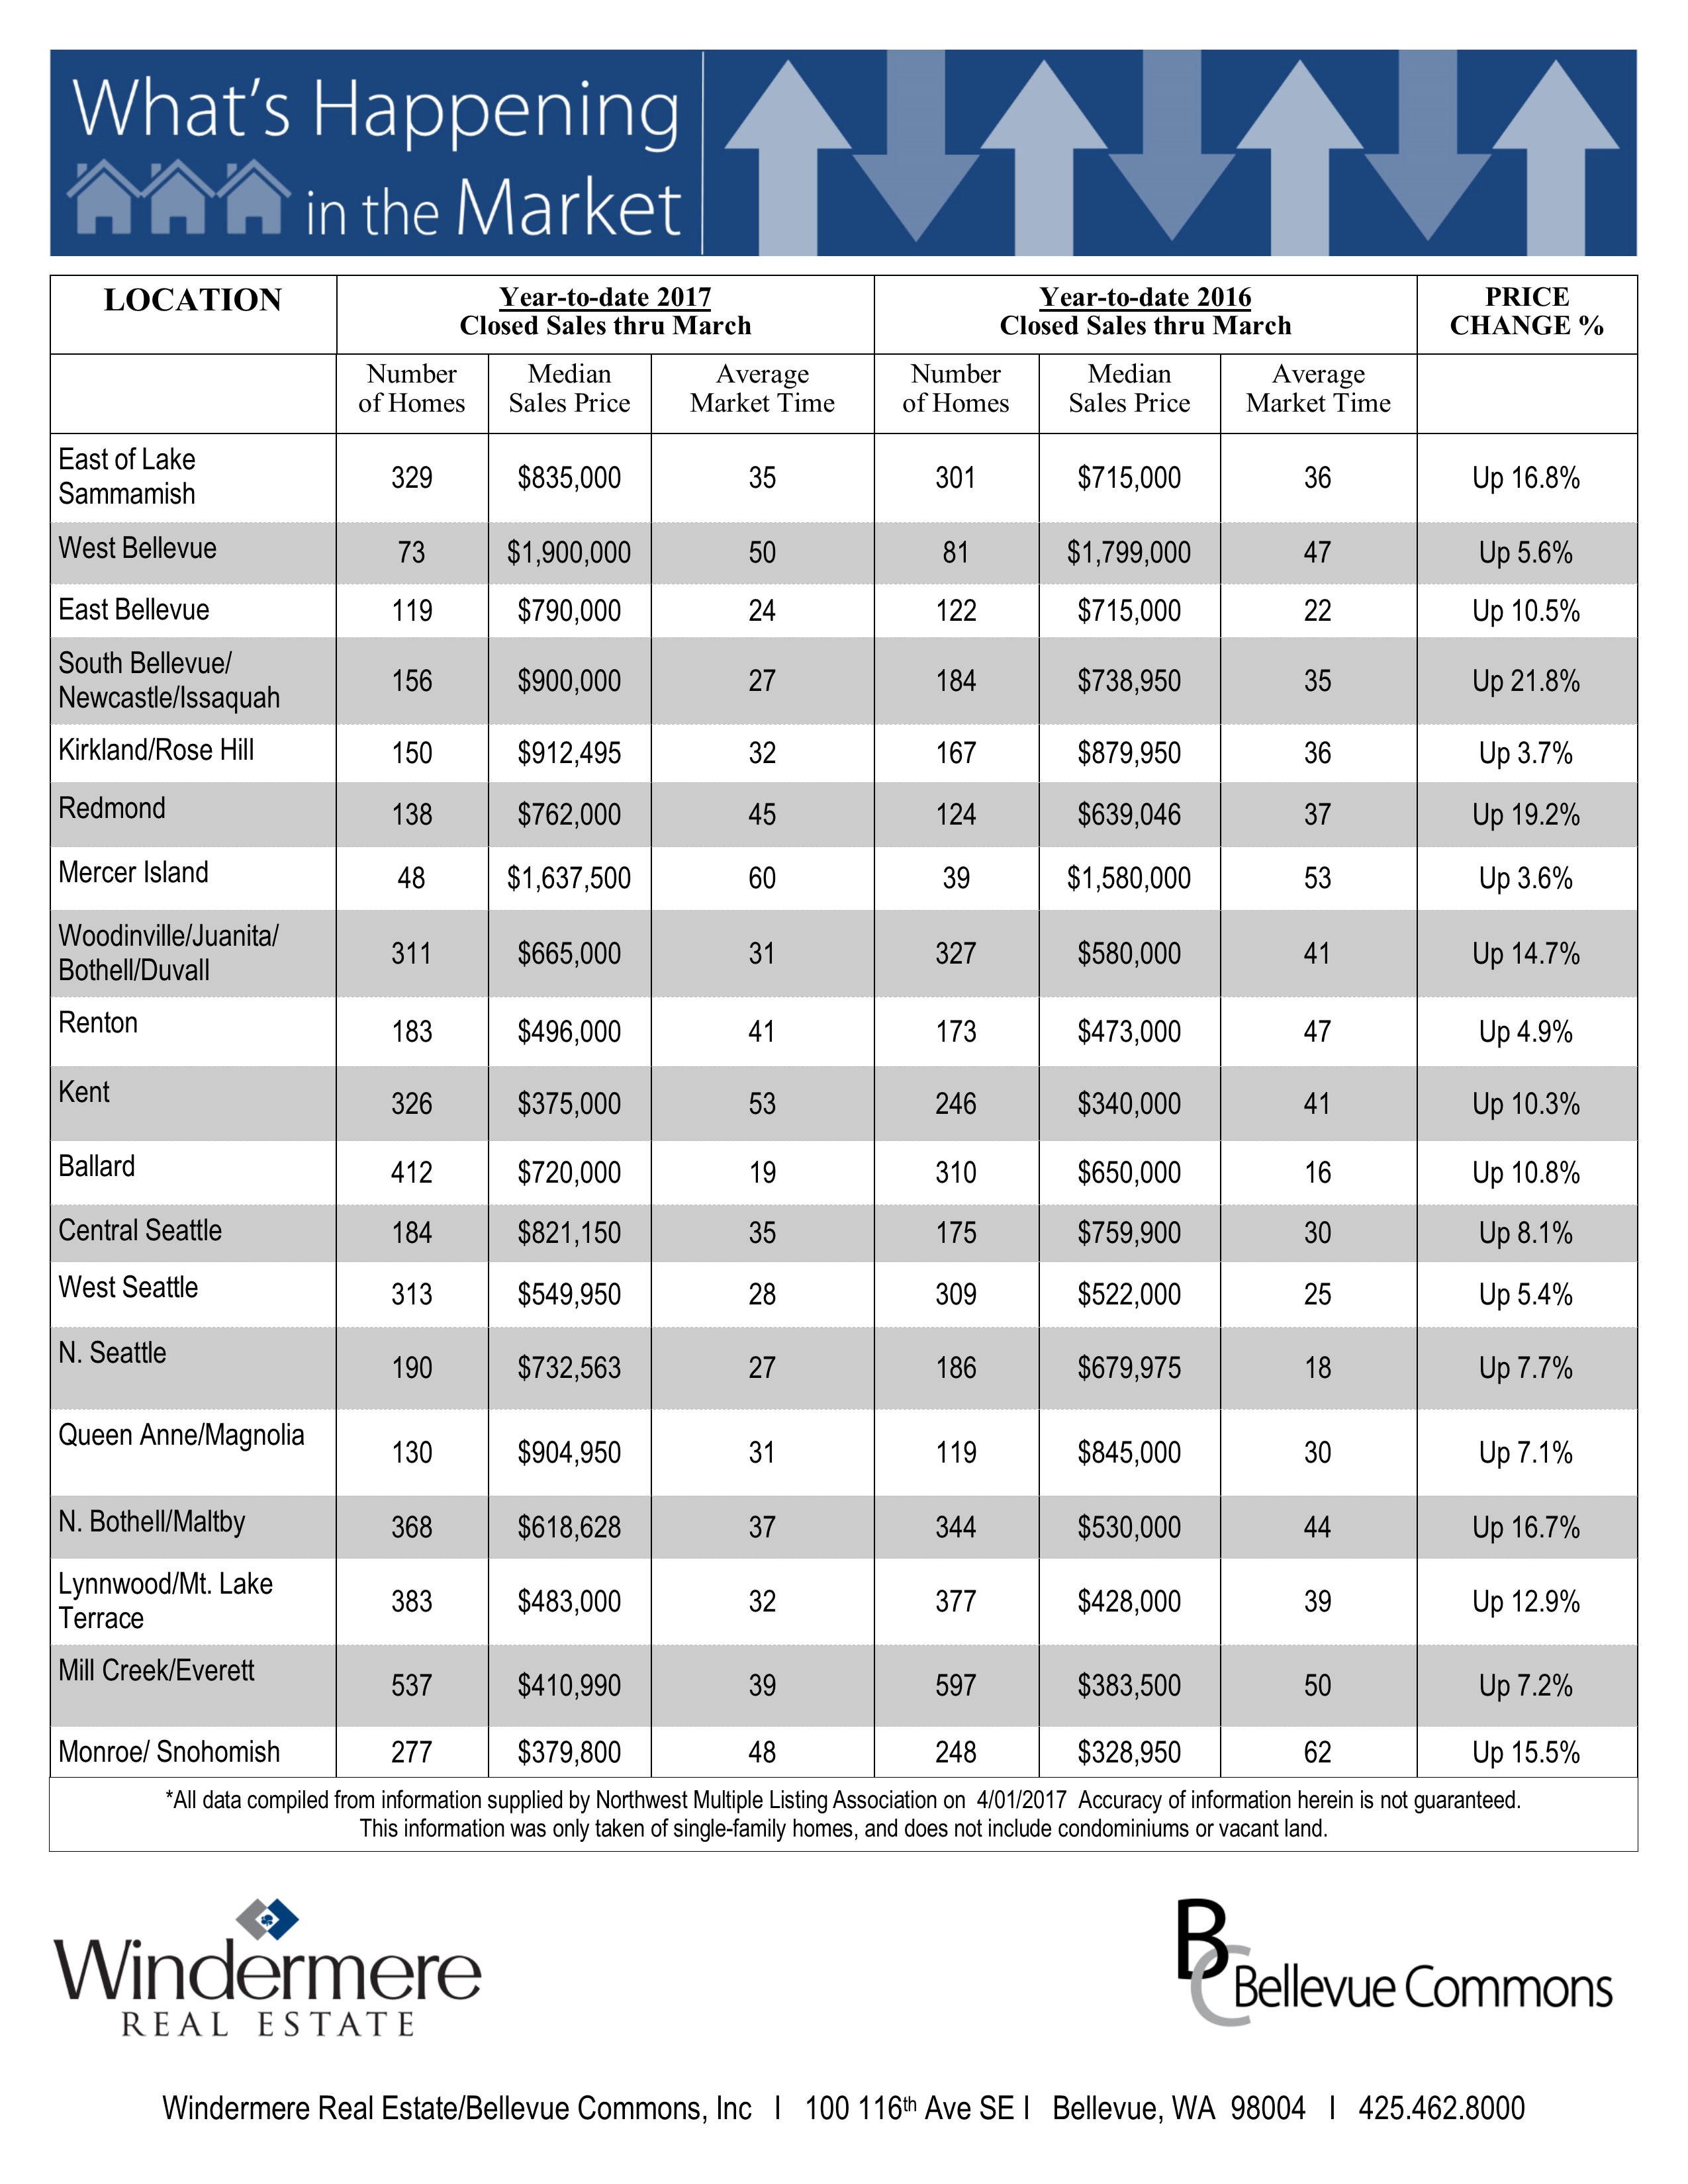
What’s Happening in the Market
- Closed median price at an all-time high of $736,500, up 20% from a year ago.
- Price appreciation is being driven by low supply and high demand. Eastside month’s supply of inventory is less than three weeks (0.7 months), the lowest ever.
- 737 active listings as of 3/31/17. Down 21% from last year and 42% from the year before.
- Scarcity has buyers paying above list price on 61% of the sales that closed in March.
- What was the cost of waiting on year (March 2016 vs March 2017) to buy? $120,400 more in median price. Interest rates up .51%. $769 a month more for the same home.

