Windermere Bellevue Commons News August 23, 2023

How to Turn Your Home Into a Vacation Rental

So, you want to become an AirBnB host. How do go about converting your property into a vacation destination?

The hospitality industry has been hard at work to regain its foothold with stir-crazy consumers who have a whole new set of values post-Covid. The growing popularity of the short-term vacation rental is poised to redefine the nature of vacationing for years to come, thanks to increased space, flexibility, and lower average rates.

The demographic for Airbnb guests is changing as well, as Gen Z and millennials are more inclined to travel with groups of friends rather than just their immediate family. Future Airbnb owners can capitalize on this trends for unique, photogenic accommodations that hotels can’t always provide.

If you are willing to put in the hard work, your vacation rental can turn a good profit, and we’ve got a quick guide to get you started!

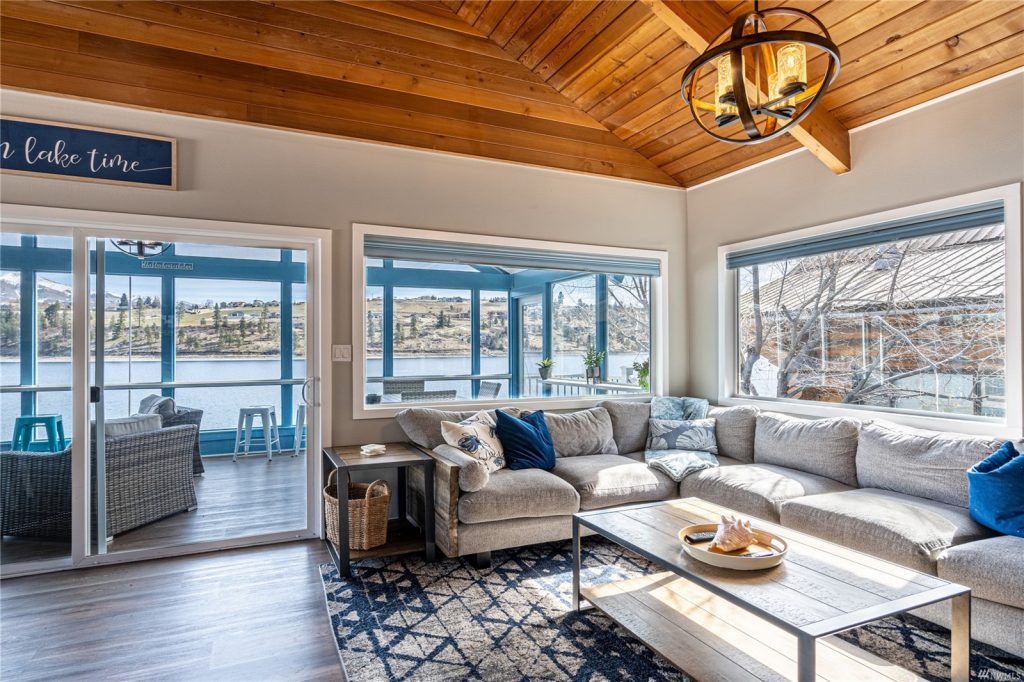
Image Courtesy of NWMLS Listing – Duke Young

Laws & Logistics

Converting your home into a vacation rental isn’t as easy as listing it on a site like AirBnB. There are a lot of hoops to jump through regarding local regulations, insurance policies, market trends and HOA rules. Start your research by looking into the ordinances of the city where you are located, as municipal law can vary even within the same state.

Seattle law, for example, states that property owners are restricted to operating a maximum of 2 dwelling units as short-term rentals, whereas Bellingham only requires that short-term rental operators obtain the appropriate vacation rental permit and pay the associated fee. Paying attention to regional codes is an important first step towards turning your property into a vacation rental.

Looking into the local market is a great way to get a feel for whether or not your vacation rental has a chance to really succeed in that area. “Look for your direct competitors,” advises Alex Haler, a strategic account executive with AirDNA, “What are they doing well? Do any of them have a particular amenity or feature that is helping them outperform the others? Keep track of this group of competitors as they will aid you in setting the right price, benchmarking your performance and staying ahead of the curve.”

Image Courtesy of NWMLS Listing – Duke Young


Reduce, Repair & Redecorate

The next step is to take care of any necessary repairs, update the furniture and install new tech if need be. Start by depersonalizing the space – as much as you love those family mementos, you are selling a space as a blank canvas for others to create their own memories.

Install smart technology to enhance connectivity for your guests and to keep an eye on your property when you can’t be there in person. Electronic locks that can be managed via the internet are a great addition, as they generate unique codes for each guest stay and make the check-in process quicker and easier.

Now is the time to take care of those pesky quirks that you have grown accustomed to, like squeaky doors or testy faucets. While some guests may not even register these issues, you are investing in your property’s longevity. By being proactive with repairs from the get-go, you save yourself stress and potentially more costly problems down the line.

When decorating, consider the aesthetic of your vacation rental and how it will complement the local vibe. What draws people to the area? Would a coastal motif fit best or would a cozy cabin vibe be more appropriate? “Think about how your guests are going to use the space, rather than simply throwing things together,” advises Nikki Kaestner, a Senior Design Associate with Vacasa.

Good design isn’t about finding matchy-matchy pieces, but creating a space that feels like a home. This can be achieved by layering pieces for a lived-in look that don’t necessarily match but blend cohesively. Make sure you invest in sturdy, quality materials (especially in high touch areas like dining rooms) that can withstand the wear and tear of multiple guests over several seasons – this includes solid wood tables and fabrics that have passed the Martindale test for performance, like Sunbrella.

Stock Up On Supplies

You’re almost ready to welcome your first guests! All that’s left is making sure all the little essentials are well-stocked. Guests are always on the lookout for amenities such as extra towels, sheets and basic toiletries. These are items that are used the most and are almost always left behind in a packing frenzy.

Invest in quality bedding, kitchen supplies and travel-size toiletries to make your vacation rental stand out from the crowd. Being an over-prepared vacation rental host by anticipating these needs can make the difference between a glowing review and an unsatisfied comment that affects future bookings.

Image Courtesy of NWMLS Listing – Duke Young

Advice From An Agent

Don’t just take our word for it! We sat down with WBC broker, Mylo Adams, one our amazing real estate professionals for her tips on property management. “Vacation rental listing setup is the most important,” Mylo advises, “Be sure to verify your property may legally be used as a vacation rental.” This means understanding tax liability on the city, state and federal level, including excise, Business & Occupation (B&O) and capital gains tax.

Mylo’s Top Tips
– Prepare a Rules & Regulations handbook for your guests, as many condominiums allowing vacation rentals have specific rules.
– Invest in excellent professional photos. Did you know that professional photos can lead up to 20% more bookings?
– Respond to inquiries quickly (within 1 hour).
– Clean, Clean, CLEAN! Hire a professional cleaning service to make sure everything looks its best.


Its no secret that the nature of travel has changed over the last few years, creating new opportunities for homeowners to get involved in the field of hospitality and generate another revenue stream. If you think that converting your property into a short-term or vacation rental sounds like the right move, make sure you are doing as much research as possible. It’s a competitive market but creating an insta-worthy escape can pay significant dividends if done right.

Happy hosting!


Written by Makena Schoene


Featured Image Source: NWMLS Listing Courtesy of Duke Young

ForecastsHome BuyingWindermere Bellevue Commons News January 6, 2020

2020 Predictions: What Will Impact the Housing Market?

This will be an interesting year for residential real estate. With a presidential election taking place this fall and talk of a possible recession occurring before the end of the year, predicting what will happen in the 2020 U.S. housing market can be challenging. As a result, taking a look at the combined projections from the most trusted entities in the industry when it comes to mortgage rateshome sales, and home prices is incredibly valuable – and they may surprise you.

Mortgage Rates

Projections from the experts at the National Association of Realtors (NAR), the Mortgage Bankers Association (MBA), Fannie Mae, and Freddie Mac all forecast mortgage rates remaining stable throughout 2020:

Since rates have remained under 5% for the last decade, we may not fully realize the opportunity we have right now.
Here are the average mortgage interest rates over the last several decades:

  • 1970s: 8.86%
  • 1980s: 12.70%
  • 1990s: 8.12%
  • 2000s: 6.29%

Home Sales

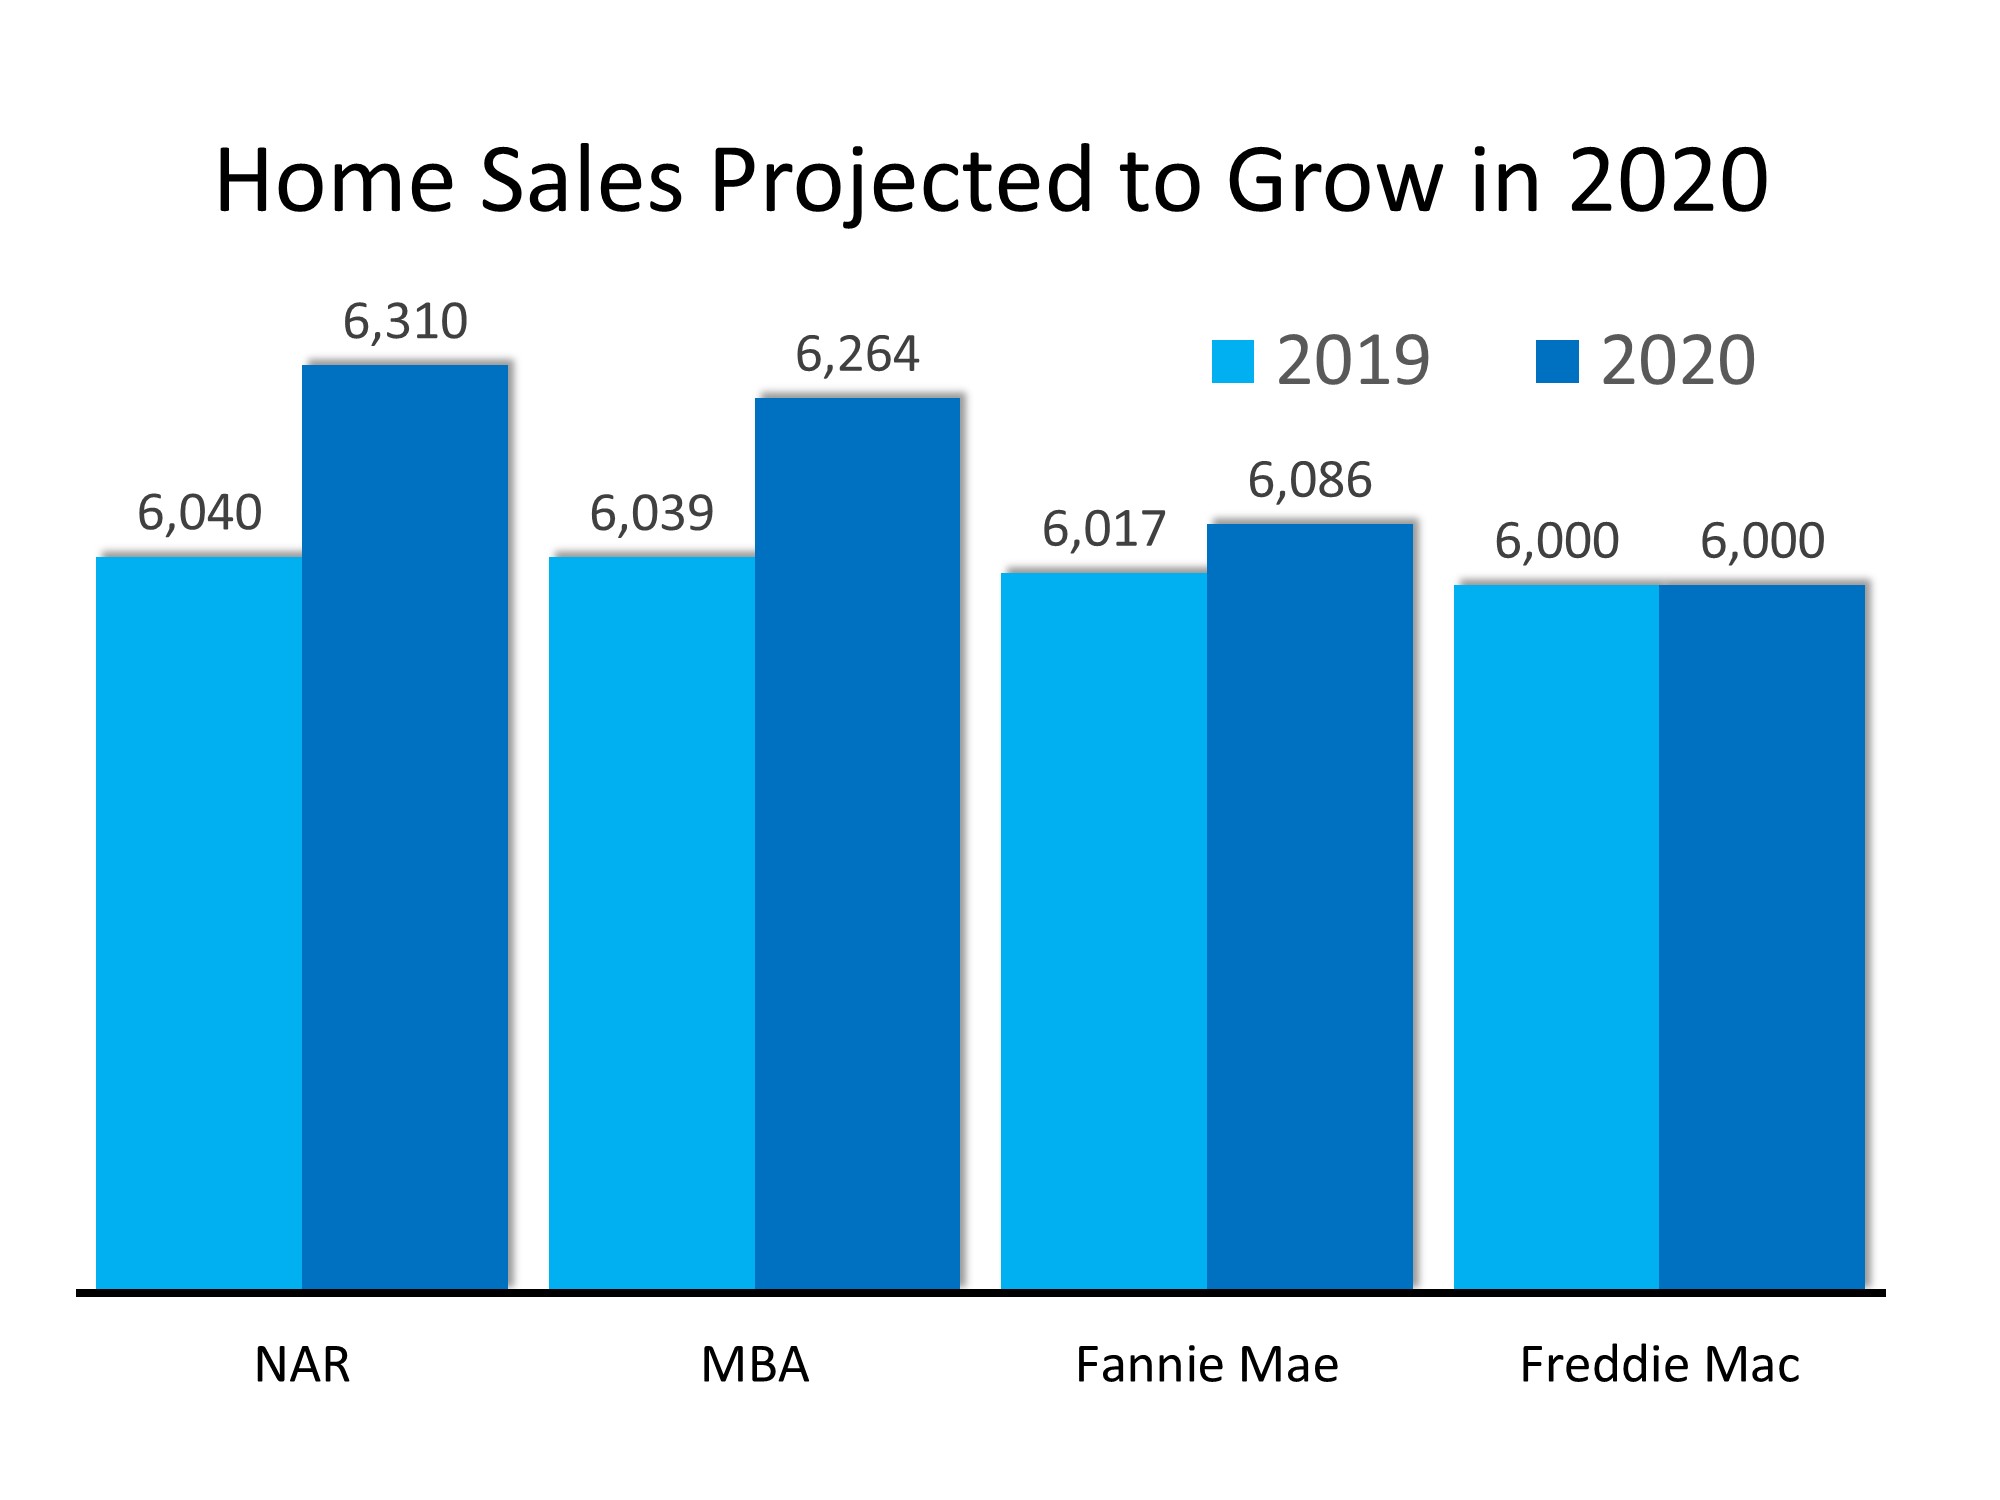
Three of the four expert groups noted above also predict an increase in home sales in 2020, and the fourth sees the transaction number remaining stable:The 2020 Real Estate Projections That May Surprise You | MyKCMWith mortgage rates remaining near all-time lows, demand should not be a challenge. The lack of available inventory, however, may moderate the increase in sales.

Home Prices

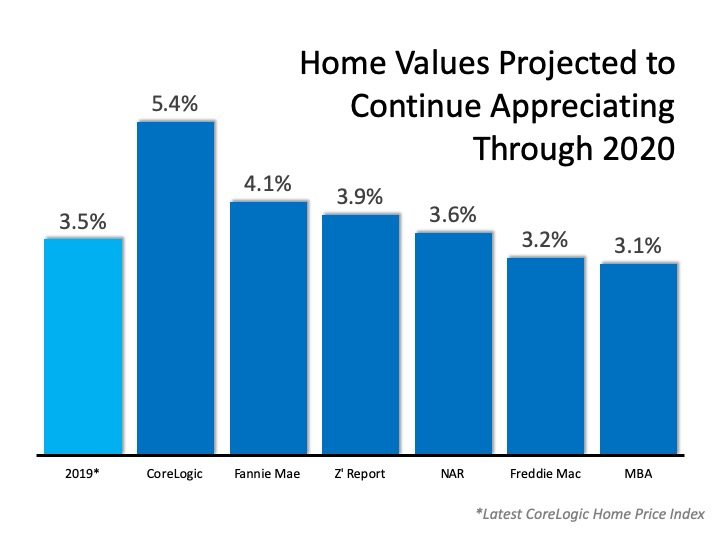
Below are the projections from six different expert entities that look closely at home values: CoreLogicFannie Mae, Ivy Zelman’s “Z Report”, the National Association of Realtors (NAR), Freddie Mac, and the Mortgage Bankers Association (MBA).The 2020 Real Estate Projections That May Surprise You | MyKCMEach group has home values continuing to improve through 2020, with four of them seeing price appreciation increasing at a greater pace than it did in 2019.

Is a Recession Possible?

In early 2019, a large percentage of economists began predicting a recession may occur in 2020. In addition, a recent survey of potential home purchasers showed that over 50% agreed it would occur this year. The economy, however, remained strong in the fourth quarter, and that has caused many to rethink the possibility.

For example, Goldman Sachs, in their 2020 U.S. Outlook, explained:

“Markets sounded the recession alarm this year, and the average forecaster now sees a 33% chance of recession over the next year. In contrast, our new recession model suggests just a 20% probability. Despite the record age of the expansion, the usual late-cycle problems—inflationary overheating and financial imbalances—do not look threatening.”

Bottom Line

Mortgage rates are projected to remain under 4%, causing sales to increase in 2020. With growing demand and a limited supply of inventory, prices will continue to appreciate, while the threat of an impending recession seems to be softening. It looks like 2020 may be a solid year for the real estate market.


Originally published on Keeping Current Matters

Market StatsWindermere Bellevue Commons News April 25, 2018

The Gardner Report – First Quarter 2018

Western Washington Real Estate Market Update


The following analysis of the Western Washington real estate market is provided by Windermere Real Estate Chief Economist Matthew Gardner. We hope that this information may assist you with making better-informed real estate decisions. For further information about the housing market in your area, please don’t hesitate to contact me.


ECONOMIC OVERVIEW

The Washington State economy added 96,900 new jobs over the past 12 months, representing an annual growth rate of 2.9%—still solidly above the national rate of 1.5%. Most of the employment gains were in the private sector, which rose by 3.4%. The public sector saw a more modest increase of 1.6%.

The strongest growth was in the Education & Health Services and Retail sectors, which added 17,300 and 16,700 jobs, respectively. The Construction sector added 10,900 new positions over the past 12 months.

Even with solid increases in jobs, the state unemployment rate held steady at 4.7%—a figure that has not moved since September of last year.

I expect the Washington State economy to continue adding jobs in 2018, but not at the same rate as last year given that we are nearing full employment. That said, we will still outperform the nation as a whole when it comes to job creation.


HOME SALES ACTIVITY

  • There were 14,961 home sales during the first quarter of 2018. This is a drop of 5.4% over the same period in 2017.
  • Clallam County saw sales rise the fastest relative to the first quarter of 2017, with an increase of 16.5%. In most of the other markets, the lack of available homes for sale slowed the number of closings during this period.
  • Listing inventory in the quarter was down by 17.6% when compared to the first quarter of 2017, but pending home sales rose by 2.6% over the same period, suggesting that closings in the second quarter should be fairly robust.
  • The takeaway from this data is that the lack of supply continues to put a damper on sales. I also believe that the rise in interest rates in the finalquarter of 2017 likely pulled sales forward, leading to a drop in sales in the first quarter of 2018.


HOME PRICES


  • With ongoing limited inventory, it’s not surprising that the growth in home prices continues to trend well above the long-term average. Year-over-year, average prices rose 14.4% to $468,312.
  • Economic vitality in the region is leading to robust housing demand that far exceeds supply. Given the relative lack of new construction homes— something that is unlikely to change any time soon—there will continue to be pressure on the resale market. As a result, home prices will continue to rise at above-average rates in the coming year.
  • When compared to the same period a year ago, price growth was strongest in Grays Harbor County at 27.5%. Ten additional counties experienced double-digit price growth.
  • Mortgage rates continued to rise during first quarter, and are expected to increase modestly in the coming months. By the end of the year, interest rates will likely land around 4.9%, which should take some of the steam out of price growth. This is actually a good thing and should help address the challenges we face with housing affordability—especially in markets near the major job centers.


DAYS ON MARKET

  • The average number of days it took to sell a home dropped by seven days when compared to the same quarter of 2017.
  • King County continues to be the tightest market in Western Washington, with homes taking an average of 24 days to sell. Every county in the region saw the length of time it took to sell a home either drop or remain essentially static relative to the same period a year ago.
  • In looking at the entire region, it took an average of 61 days to sell a home in the first quarter of this year. This is down from 68 days in the firstquarter of 2017 but up by eleven days when compared to the fourth quarter of 2017.
  • Anyone expecting to see a rapid rise in the number of homes for sale in 2018 will likely be disappointed. New construction permit activity—a leading indicator—remains well below historic levels and this will continue to put increasing pressure on the resale home market.


CONCLUSIONS

This speedometer reflects the state of the region’s housing market using housing inventory, price gains, home sales, interest rates, and larger economic factors. For the first quarter of 2018, I have left the needle at the same point as fourth quarter of last year. Price growth remains strong even as sales activity slowed. All things being equal, 2018 is setting itself up to be another very good year for sellers but, unfortunately, not for buyers who will still see stiff competition for the limited number of available homes for sale.


Mr. Gardner is the Chief Economist for Windermere Real Estate, specializing in residential market analysis, commercial/industrial market analysis, financial analysis, and land use and regional economics. He is the former Principal of Gardner Economics, and has more than 30 years of professional experience both in the U.S. and U.K.

Market StatsWindermere Bellevue Commons News January 29, 2018

The Gardner Report – Fourth Quarter 2017

Western Washington Real Estate Market Update

ECONOMIC OVERVIEW

The Washington State economy added 104,600 new jobs over the past 12 months. This impressive growth rate of 3.1% is well above the national rate of 1.4%. Interestingly, the slowdown we saw through most of the second half of the year reversed in the fall, and we actually saw more robust employment growth.

Growth continues to be broad-based, with expansion in all major job sectors other than aerospace due to a slowdown at Boeing.

With job creation, the state unemployment rate stands at 4.5%, essentially indicating that the state is close to full employment. Additionally, all counties contained within this report show unemployment rates below where they were a year ago.

I expect continued economic expansion in Washington State in 2018; however, we are likely to see a modest slowdown, which is to be expected at this stage in the business cycle.


HOME SALES ACTIVITY

  • There were 22,325 home sales during the final quarter of 2017. This is an increase of 3.7% over the same period in 2016.
  • Jefferson County saw sales rise the fastest relative to fourth quarter of 2016, with an impressive increase of 22.8%. Six other counties saw double-digit gains in sales. A lack of listings impacted King and Skagit Counties, where sales fell.
  • Housing inventory was down by 16.2% when compared to the fourth quarter of 2016, and down by 17.3% from last quarter. This isn’t terribly surprising since we typically see a slowdown as we enter the winter months. Pending home sales rose by 4.1% over the third quarter of 2017, suggesting that closings in the first quarter of 2018 should be robust.
  • The takeaway from this data is that listings remain at very low levels and, unfortunately, I don’t expect to see substantial increases in 2018. The region is likely to remain somewhat starved for inventory for the foreseeable future.


HOME PRICES


  • Because of low inventory in the fall of 2017, price growth was well above long-term averages across Western Washington. Year-over-year, average prices rose 12% to $466,726.
  • Economic vitality in the region is leading to a demand for housing that far exceeds supply. Given the relative lack of newly constructed homes—something that is unlikely to change any time soon—there will continue to be pressure on the resale market. This means home prices will rise at above-average rates in 2018.
  • Compared to the same period a year ago, price growth was most pronounced in Lewis County, where home prices were 18.8% higher than a year ago. Eleven additional counties experienced double-digit price growth as well.
  • Mortgage rates in the fourth quarter rose very modestly, but remained below the four percent barrier. Although I anticipate rates will rise in 2018, the pace will be modest. My current forecast predicts an average 30-year rate of 4.4% in 2018—still remarkably low when compared to historic averages.


DAYS ON MARKET

  • The average number of days it took to sell a home in the fourth quarter dropped by eight days, compared to the same quarter of 2016.
  • King County continues to be the tightest market in Western Washington, with homes taking an average of 21 days to sell. Every county in the region saw the length of time it took to sell a home either drop or remain static relative to the same period a year ago.
  •  Last quarter, it took an average of 50 days to sell a home. This is down from 58 days in the fourth quarter of 2016, but up by 7 days from the third quarter of 2017.
  • As mentioned earlier in this report, I expect inventory levels to rise modestly, which should lead to an increase in the average time it takes to sell a house. That said, with homes selling in less than two months on average, the market is nowhere near balanced.


CONCLUSIONS

This speedometer reflects the state of the region’s housing market using housing inventory, price gains, home sales, interest rates, and larger economic factors. For the fourth quarter of 2017, I have left the needle at the same point as third quarter. Price growth remains robust even as sales activity slowed. 2018 is setting itself up to be another very good year for housing.


Matthew Gardner is the Chief Economist for Windermere Real Estate, specializing in residential market analysis, commercial/industrial market analysis, financial analysis, and land use and regional economics. He is the former Principal of Gardner Economics, and has more than 30 years of professional experience both in the U.S. and U.K.

Market StatsWindermere Bellevue Commons News November 2, 2017

Greater Seattle Area Real Estate Market – 3rd Quarter 2017

The Gardner Report – Third Quarter 2017


ECONOMIC OVERVIEW

The Washington State economy added 79,600 new jobs over the past 12 months—an impressive growth rate of 2.4%, and well above the national growth rate of 1.2%. However, as we anticipated in last quarter’s report, we continue to see a modest slowdown in the growth rate as the state grows closer to full employment. Growth has been broad-based, with expansion in all major job sectors other than Aerospace (a function of a slowdown at Boeing). Given the current rate of expansion, I am raising my employment forecast and now predict that Washington will add 81,000 new jobs in 2017.

Given the robust job market, it is unsurprising that the state unemployment rate continues to fall. The current unemployment rate in Washington State is 4.6% and we are essentially at full employment. Additionally, all counties contained within this report reported either a drop or stability in their unemployment rate from a year ago. I maintain my belief that the Washington State economy will continue to outperform the U.S. as a whole. Given such a strong expansion, we should also expect solid income growth across Western Washington.


HOME SALES ACTIVITY

  • There were 25,312 home sales during the third quarter of 2017. This is an increase of 3.6% over the same period in 2016.
  • Clallam County maintains its number one position for sales growth over the past 12 months. Only four other counties saw double-digit gains in sales. This demonstrates continuing issues with the low supply of listings. There were modest declines in sales activity in six counties.
  • The market remains remarkably tight with listing inventory down by 14.2% when compared to the third quarter of 2016. But inventory is up a significant 32% compared to the second quarter of this year. Pending sales rose by 5.2% over the same quarter a year ago, which suggests that closings in Q4 will still be robust.
  • The key takeaway from this data is that inventory is still very low, and the situation is unlikely to improve through the balance of the year.


HOME PRICES

  • Given tight supply levels, it is unsurprising to see very solid price growth across the Western Washington counties. Year-over-year, average prices rose 12.3% to $474,184. This is 0.9% higher than seen in the second quarter of this year.
  • With demand far exceeding supply, price growth in Western Washington continues to trend well above the longterm average. As I do not expect to see the new home market expand at any significant pace, there will be continued pressure on the resale market, which will cause home prices to continue to rise at above-average rates.
  • When compared to the same period a year ago, price growth was most pronounced in Grays Harbor County where sale prices were 20.1% higher than the third quarter of 2016. Nine additional counties experienced double-digit price growth.
  • Mortgage rates in the quarter continue to test the lows of 2017, and this is unlikely to change in the near-term. This will allow home prices to escalate further but I expect we will see rates start to rise fairly modestly in 2018, which could slow price growth.


DAYS ON MARKET

  • The average number of days it took to sell a home in the quarter dropped by eight days when compared to the same quarter of 2016.
  • King County continues to be the tightest market, with homes taking an average of 17 days to sell. Every county except San Juan saw the days on market drop from the same period a year ago.
  • This quarter, it took an average of 43 days to sell a home. This is down from the 51 days it took in the second quarter of 2016 and down by 8 days from the second quarter of this year.
  • At some point, inventory will start to grow and this will lead to an increase in the average time it takes to sell a house. However, I do not expect that to happen at any time soon. So we remain in a seller’s market.


CONCLUSIONS

This speedometer reflects the state of the region’s housing market using housing inventory, price gains, home sales, interest rates, and larger economic factors. For the third quarter of 2017, I have left the needle at the same point as the second quarter. Though price growth remains robust, sales activity has slowed very slightly and listings jumped relative to the second quarter. That said, the market is very strong and buyers will continue to find significant competition for accurately priced and well-located homes.


ABOUT MATTHEW GARDNER

Matthew Gardner is the Chief Economist for Windermere Real Estate, specializing in residential market analysis, commercial/industrial market analysis, financial analysis, and land use and regional economics. He is the former Principal of Gardner Economics, and has more than 30 years of professional experience both in the U.S. and U.K.


Market StatsWindermere Bellevue Commons News September 14, 2017

King & Snohomish County Market Stats – August 2017


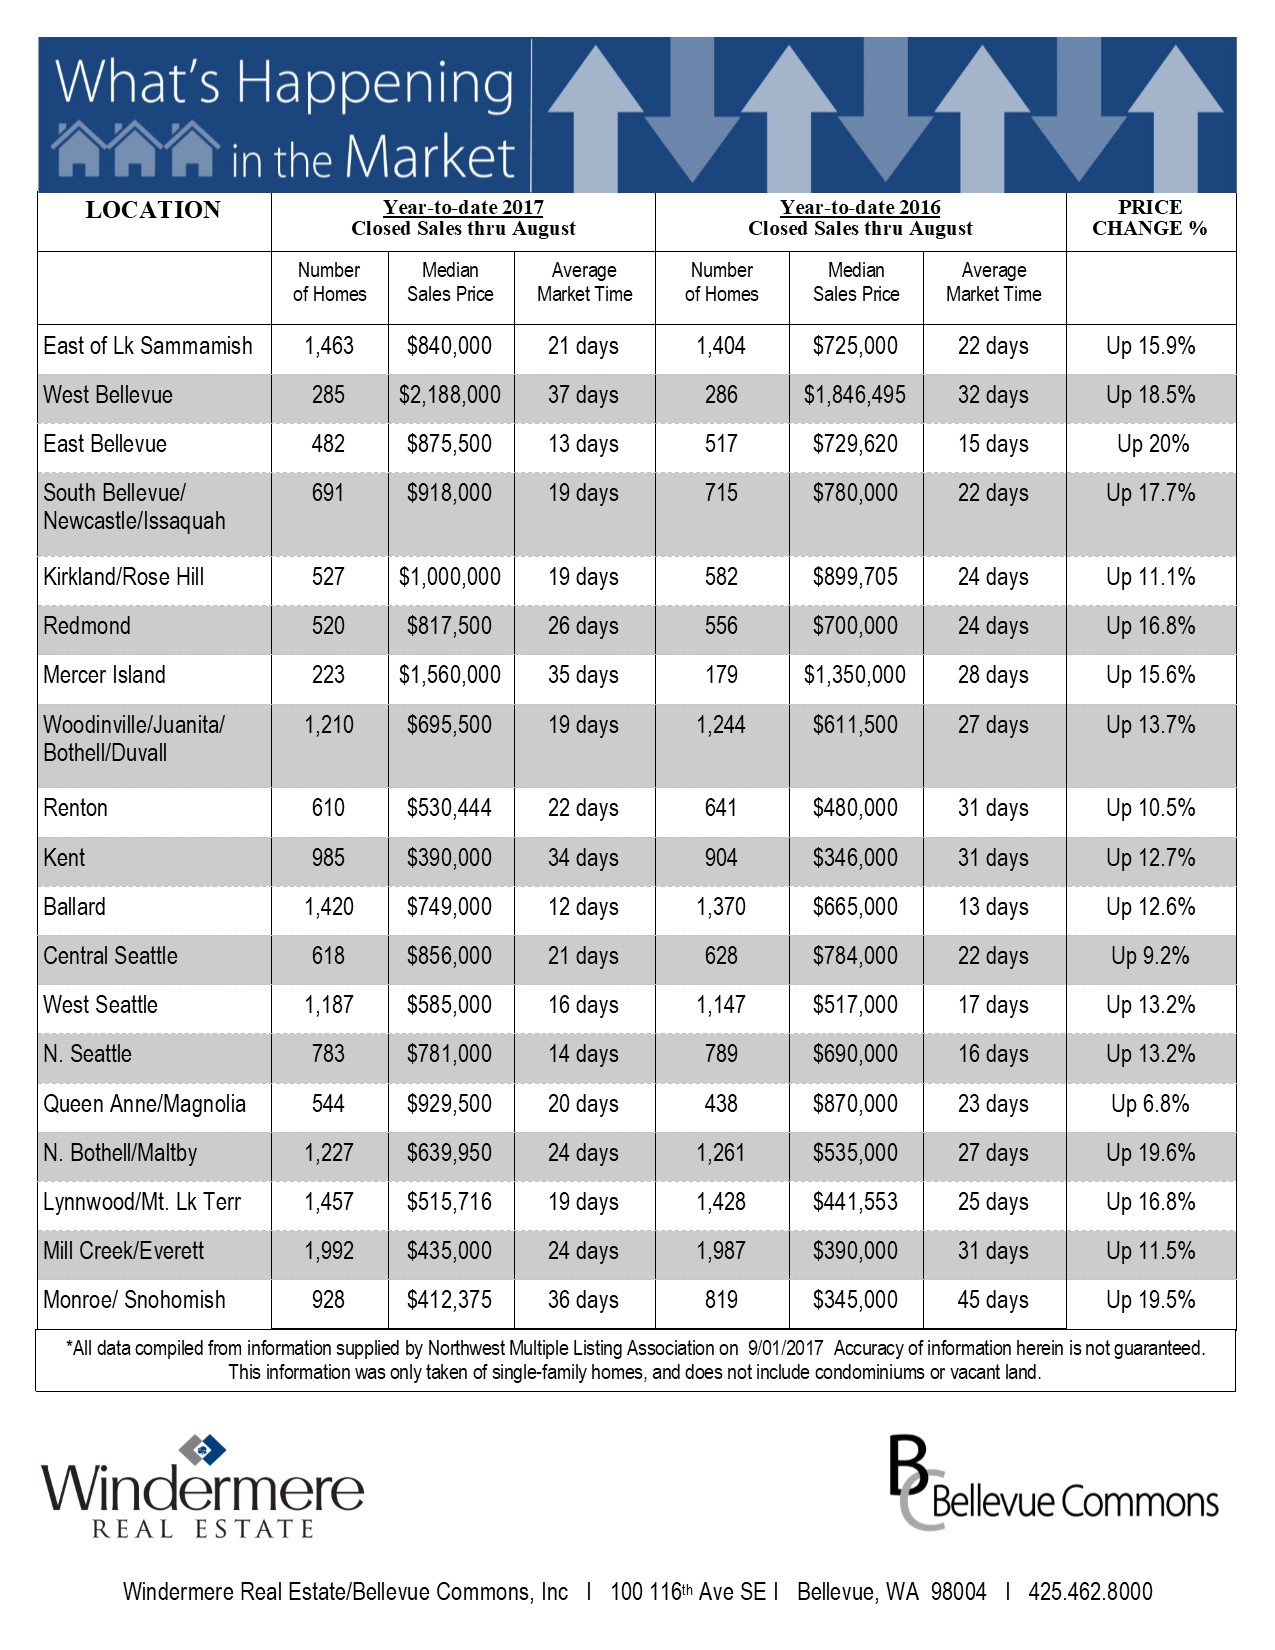
What’s Happening in the Market

Eastside (based on Residential Homes):

Low Inventory

The Real Estate market in August 2017 showed signs of slowing down, but it was interesting to see as home inventory fell, homes under $1.5M on the eastside were still selling at a fast pace while the upper end Buyers were being much pickier.


Less Sail-Fails

Another interesting thing to note was that Sale fails were continuing to drop which is a credit to more qualified Buyers and tighter contracts that are required when competing in a multiple offer situations.  It also was because of the pre-inspections being done before writing offers instead of requiring Buyers to find deficiencies and then renegotiate the terms of the contract.

Market StatsWindermere Bellevue Commons News July 26, 2017

The Gardner Report – 2nd Quarter 2017

The Gardner Report | Western Washington Q2 2017


The following analysis of the Western Washington real estate market is provided by Windermere Real Estate Chief Economist Matthew Gardner. We hope that this information may assist you with making better-informed real estate decisions. For further information about the housing market in your area, please don’t hesitate to contact me.

ECONOMIC OVERVIEW


The Washington State economy has been expanding at a rapid pace but we are seeing a slowdown as the state grows closer to full employment. Given the solid growth, I would expect to see income growth move markedly higher, though this has yet to materialize. I anticipate that we will see faster income growth in the second half of the year. I still believe that the state will add around 70,000 jobs in 2017.

Washington State, as well as the markets that make up Western Washington, continue to see unemployment fall. The latest state-wide report now shows a rate of 4.5%—the lowest rate since data started to be collected in 1976.

I believe that growth in the state will continue to outperform the U.S. as a whole and, with such robust expansion, I would not be surprised to see more people relocate here as they see Washington as a market that offers substantial opportunity.

HOME SALES ACTIVITY


  • There were 23,349 home sales during the second quarter of 2017. This is an increase of 1.1% from the same period in 2016.
  • Clallam County maintains its position as number one for sales growth over the past 12 months. Double-digit gains in sales were seen in just three other counties, which is a sharp drop from prior reports. I attribute this to inventory constraints rather than any tangible drop in demand. The only modest decline in sales last quarter was seen in Grays Harbor County.
  • The number of homes for sale, unfortunately, showed no improvement, with an average of just 9,279 listings in the quarter, a decline of 20.4% from the second quarter of 2016. Pending sales rose by 3.6% relative to the same quarter a year ago.
  • The key takeaway from this data is that it is unlikely we will see a significant increase in the number of homes for sale for the rest of 2017.
Annual Change in Home Sales

HOME PRICES


  • Along with the expanding economy, home prices continue to rise at very robust rates. Year-over-year, average prices rose 14.9%. The region’s average sales price is now $470,187.
  • Price growth in Western Washington continues to impress as competition for the limited number of homes for sale remains very strong. With little easing in supply, we anticipate that prices will continue to rise at above long-term averages.
  • When compared to the same period a year ago, price growth was most pronounced in San Juan County where sale prices were 29.2% higher than second quarter of 2016. Eight additional counties experienced double-digit price growth.
  • The specter of rising interest rates failed to materialize last quarter, but this actually functioned to get more would-be buyers off the fence and into the market. This led to even more demand which translated into rising home prices.
Western Washington Heat Map
Annual Change in Home Sale Prices

DAYS ON MARKET


  • The average number of days it took to sell a home in the quarter dropped by 18 days when compared to the same quarter of 2016.
  • King County remains the tightest market; homes, on average, sold in a remarkable 15 days. Every county in this report saw the length of time it took to sell a home drop from the same period a year ago.
  • Last quarter, it took an average of 48 days to sell a home. This is down from the 66 days it took in the second quarter of 2016.
  • Given the marked lack of inventory, I would not be surprised to see the length of time it takes to sell a home drop further before the end of the year.
Average Days on Market

CONCLUSIONS


Market Speedometer
This speedometer reflects the state of the region’s housing market using housing inventory, price gains, home sales, interest rates, and larger economic factors. For the second quarter of 2017, I moved the needle a little more in favor of sellers. To define the Western Washington market as “tight” is somewhat of an understatement. Inventory is short and buyers are plentiful. Something must give, but unless we see builders delivering substantially more units than they have been, it will remain staunchly a sellers’ market for the balance of the year. Furthermore, increasing mortgage rates have failed to materialize and, with employment and income growth on the rise, the regional housing market will continue to be very robust.

ABOUT MATTHEW GARDNER


Matthew Gardner is the Chief Economist for Windermere Real Estate, specializing in residential market analysis, commercial/industrial market analysis, financial analysis, and land use and regional economics. He is the former Principal of Gardner Economics, and has more than 30 years of professional experience both in the U.S. and U.K.
Market StatsWindermere Bellevue Commons News May 24, 2017

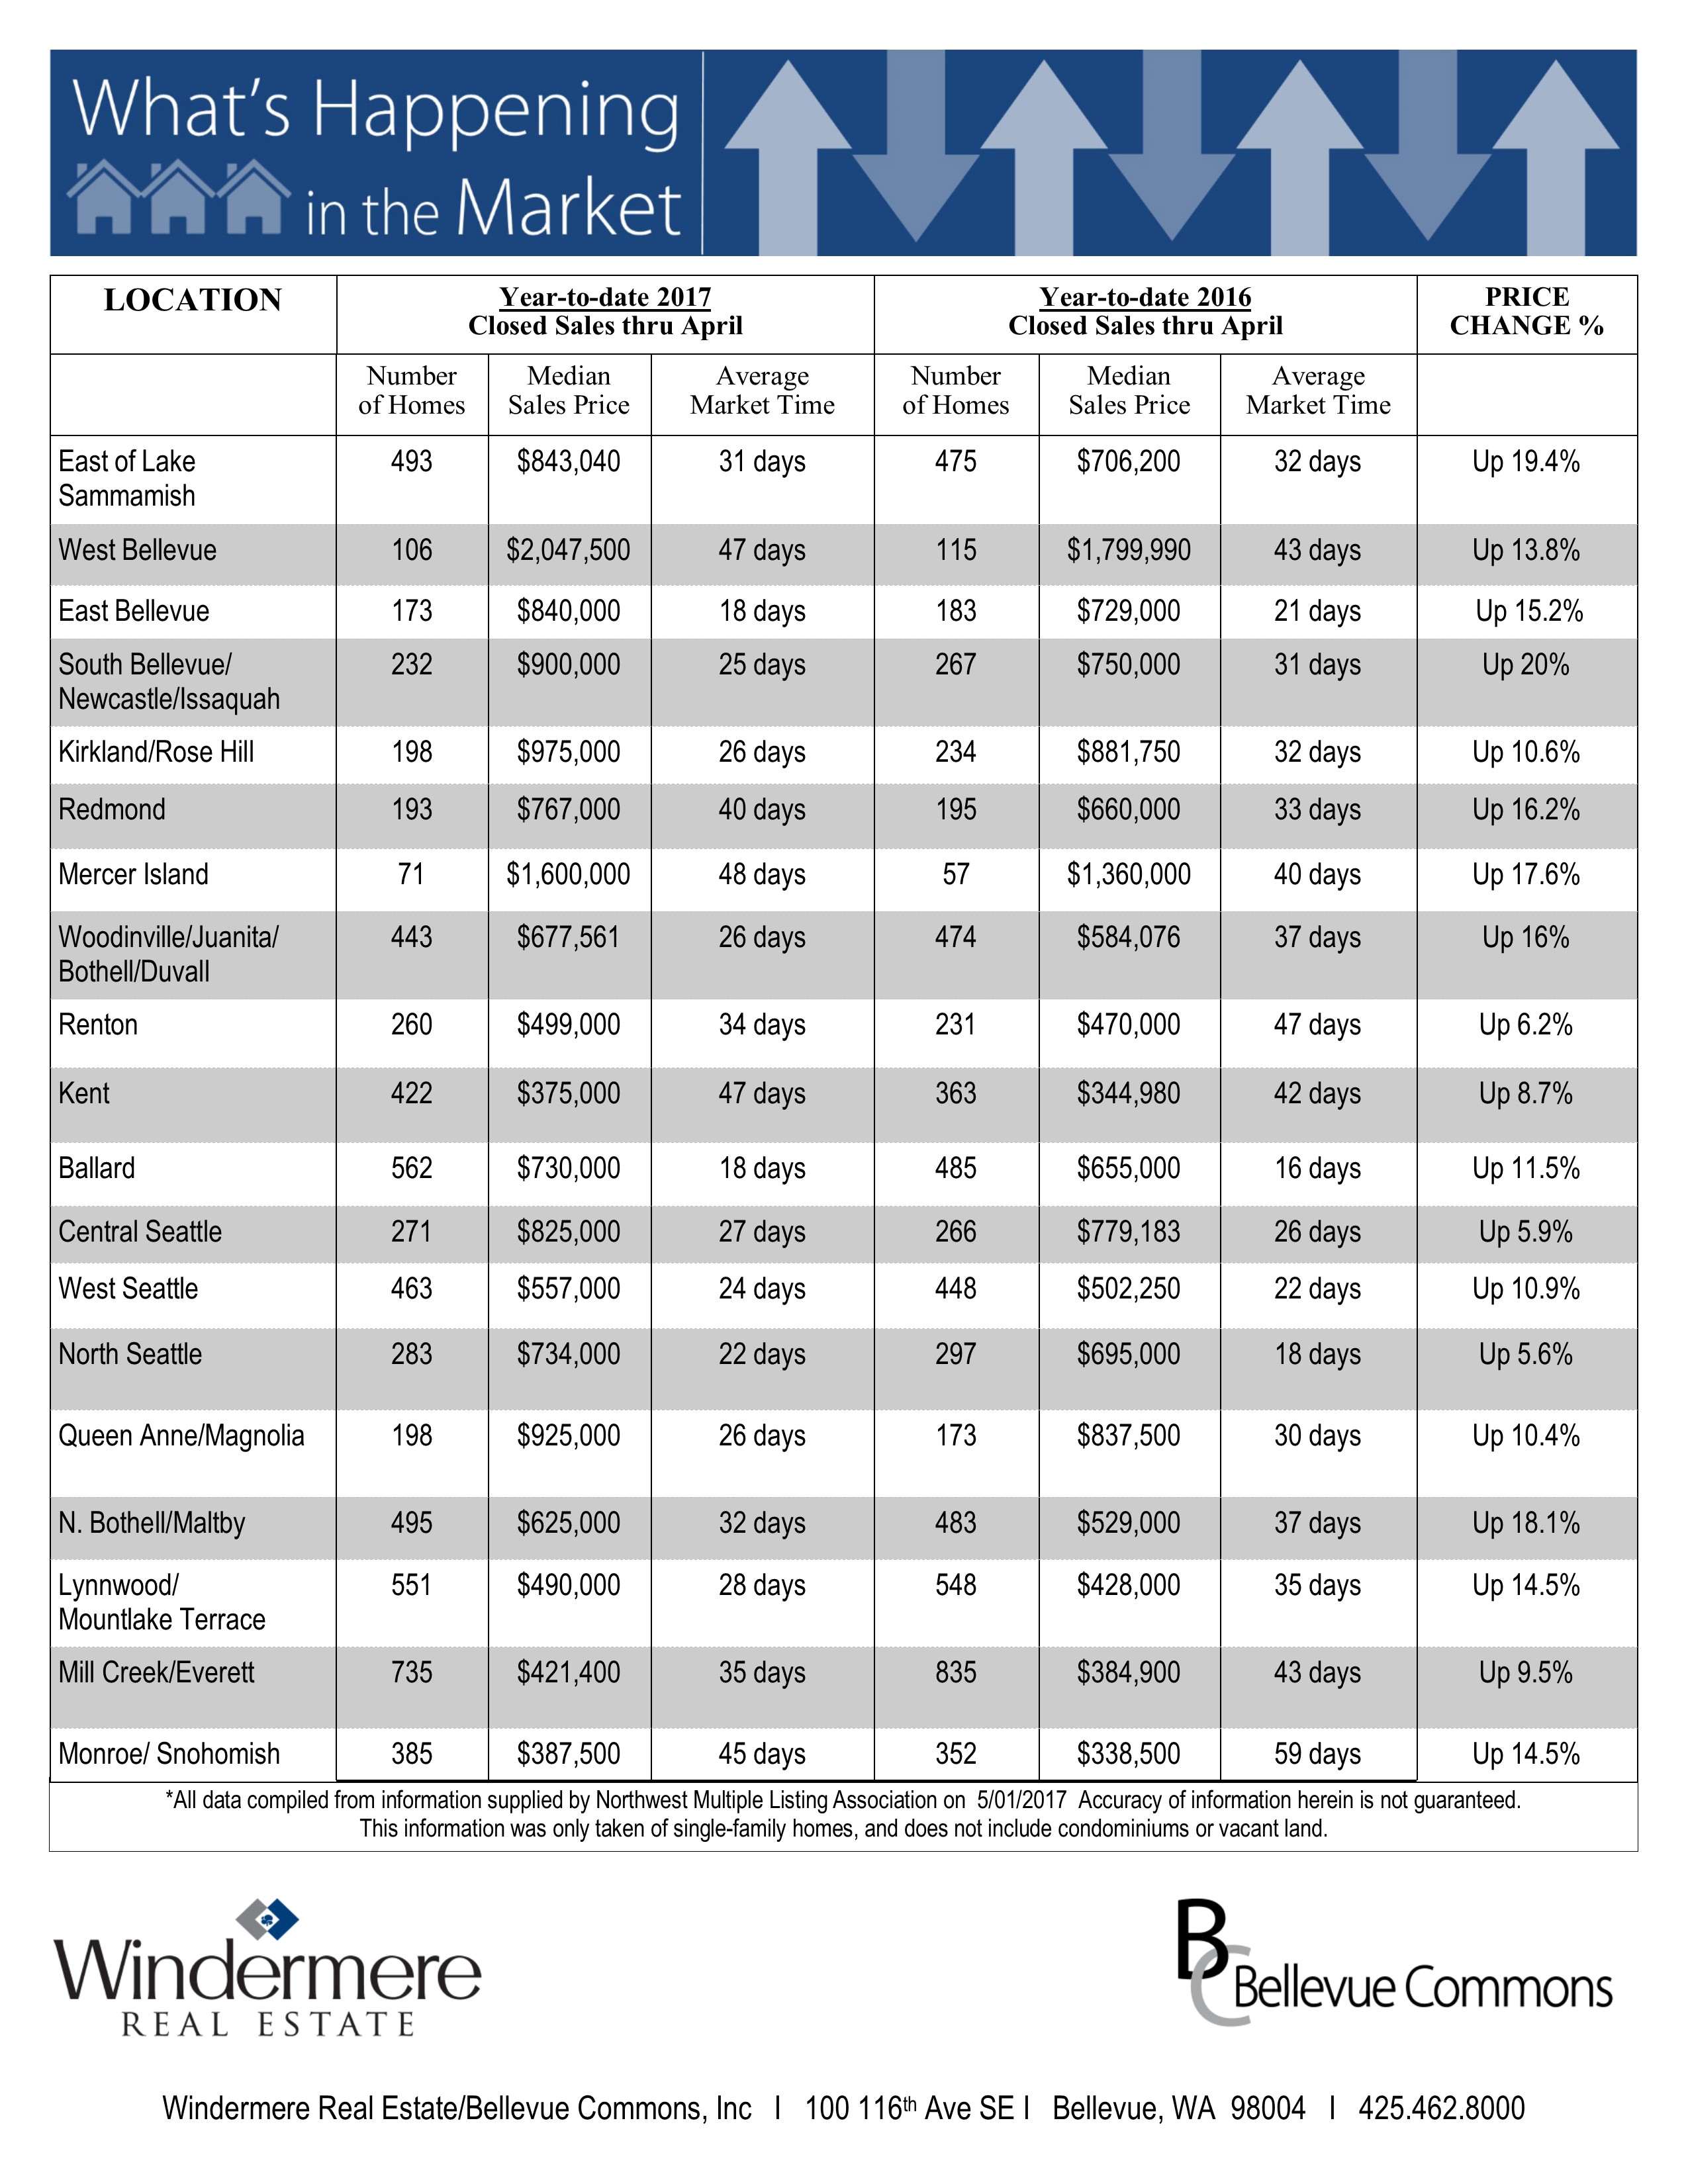
King & Snohomish County Market Stats – May 2017

What’s Happening in the Market

Eastside (based on Residential and Condominium report):

  • Closed median price at an all-time high of $748,944, up 20% from a year ago


  • Price appreciation is being driven by low supply and high demand.  Eastside months’ supply of inventory is less than three weeks, the lowest ever!


  • 748 active listings as of 4/30/17.  Down 33% from the year before and 48% from two years before.


  • Scarcity has buyers paying above list price on 65% of the sales that closed in April.


  • What was the cost of waiting on year (April 2016 vs April 2017) to buy?  $123,944 in median price.  $9,026 per year in payment.

Market StatsWindermere Bellevue Commons News May 18, 2017

The Gardner Report – First Quarter 2017

The Gardner Report – First Quarter 2017

Economic Overview

I’m happy to report that Washington State continues to add jobs at a steady rate. While the rate of growth is tapering, this is because many markets are getting close to “full employment”, during which time growth naturally slows. That said, I believe that the state will add around 70,000 jobs in 2017. Washington State, as well as the markets that make up Western Washington, continues to see unemployment fall and I anticipate that we will see this rate drop further as we move through the year. In all, the economy continues to perform at or above average levels and 2017 will be another growth year.

Home Sales

  • There were 15,652 home sales during the first quarter of 2017. This is an increase of 9.5% from the same period in 2016, but 20.7% below the total number of sales in the final quarter of 2016.
  • With an increase of 45.5%, sales in Clallam County grew at the fastest rate over the past 12 months. There were double-digit gains seen in an additional 10 counties, suggesting that demand remains very robust. The only modest decline in sales was seen in Grays Harbor County.
  • The number of homes for sale showed no improvement at all, with an average of just 6,893 homes for sale in the quarter, a decline of 33% from the previous quarter and 25% from the first quarter of 2016. Pending sales rose by 2% relative to the same quarter a year ago.
  • The key takeaway from this data is that 2017 will offer little relief to would-be home buyers as the housing supply remains severely constrained.

Home Prices

  • With demand continuing to exceed supply, home prices continued to rise at above-average rates. Year-over-year, average prices rose by 9.5% but were 1.1% lower than in the final quarter of 2016. The region’s average sales price is now $409,351.
  • Price growth in Western Washington is unlikely to taper dramatically in 2017 and many counties will continue to see prices appreciate well above their long-term averages.
  • When compared to the same period a year ago, price growth was most pronounced in Kittitas County, which rose by 19.6%. Double-digit price growth was seen in an additional 10 counties. The only market where the average price fell was in the ever-volatile San Juan County.
  • It is clear that rising interest rates have not taken much of a sheen off the market.

Days on Market

  • The average number of days it took to sell a home in the first quarter dropped by 16 days when compared to the first quarter of 2016.
  • King County remained the tightest market, with the average time to sell a home at just 31 days. Island County was the only area where it took longer to sell a home than seen a year ago; however, the increase was just one day.
  • In the first quarter of the year, it took an average of 70 days to sell a home. This is down from the 86 days it took in the first quarter of 2016, but up from the 64 days it took in the final quarter of last year.
  • Given woefully low levels of inventory in all Western Washington markets, I do not expect to see the length of time that it takes to sell a home rising in 2017. In fact, it is likely that it will continue to drop.

Conclusions

This speedometer reflects the state of the region’s housing market using housing inventory, price gains, home sales, interest rates, and larger economic factors. For the first quarter of 2017, I moved the needle a little more in favor of sellers. The rapid increase in mortgage rates during the fourth quarter of 2016 has slowed and buyers are clearly out in force.

This article originally appeared on the Windermere.com blog.

Home SellingWindermere Bellevue Commons News April 26, 2017

3 Charts That Shout, ‘List Your Home Today!’

3 Charts That Shout, ‘List Your Home Today!’ | MyKCM

In school, we all learned the theory of supply and demand. When the demand for an item is greater than the supply of that item, the price will surely rise.

SUPPLY

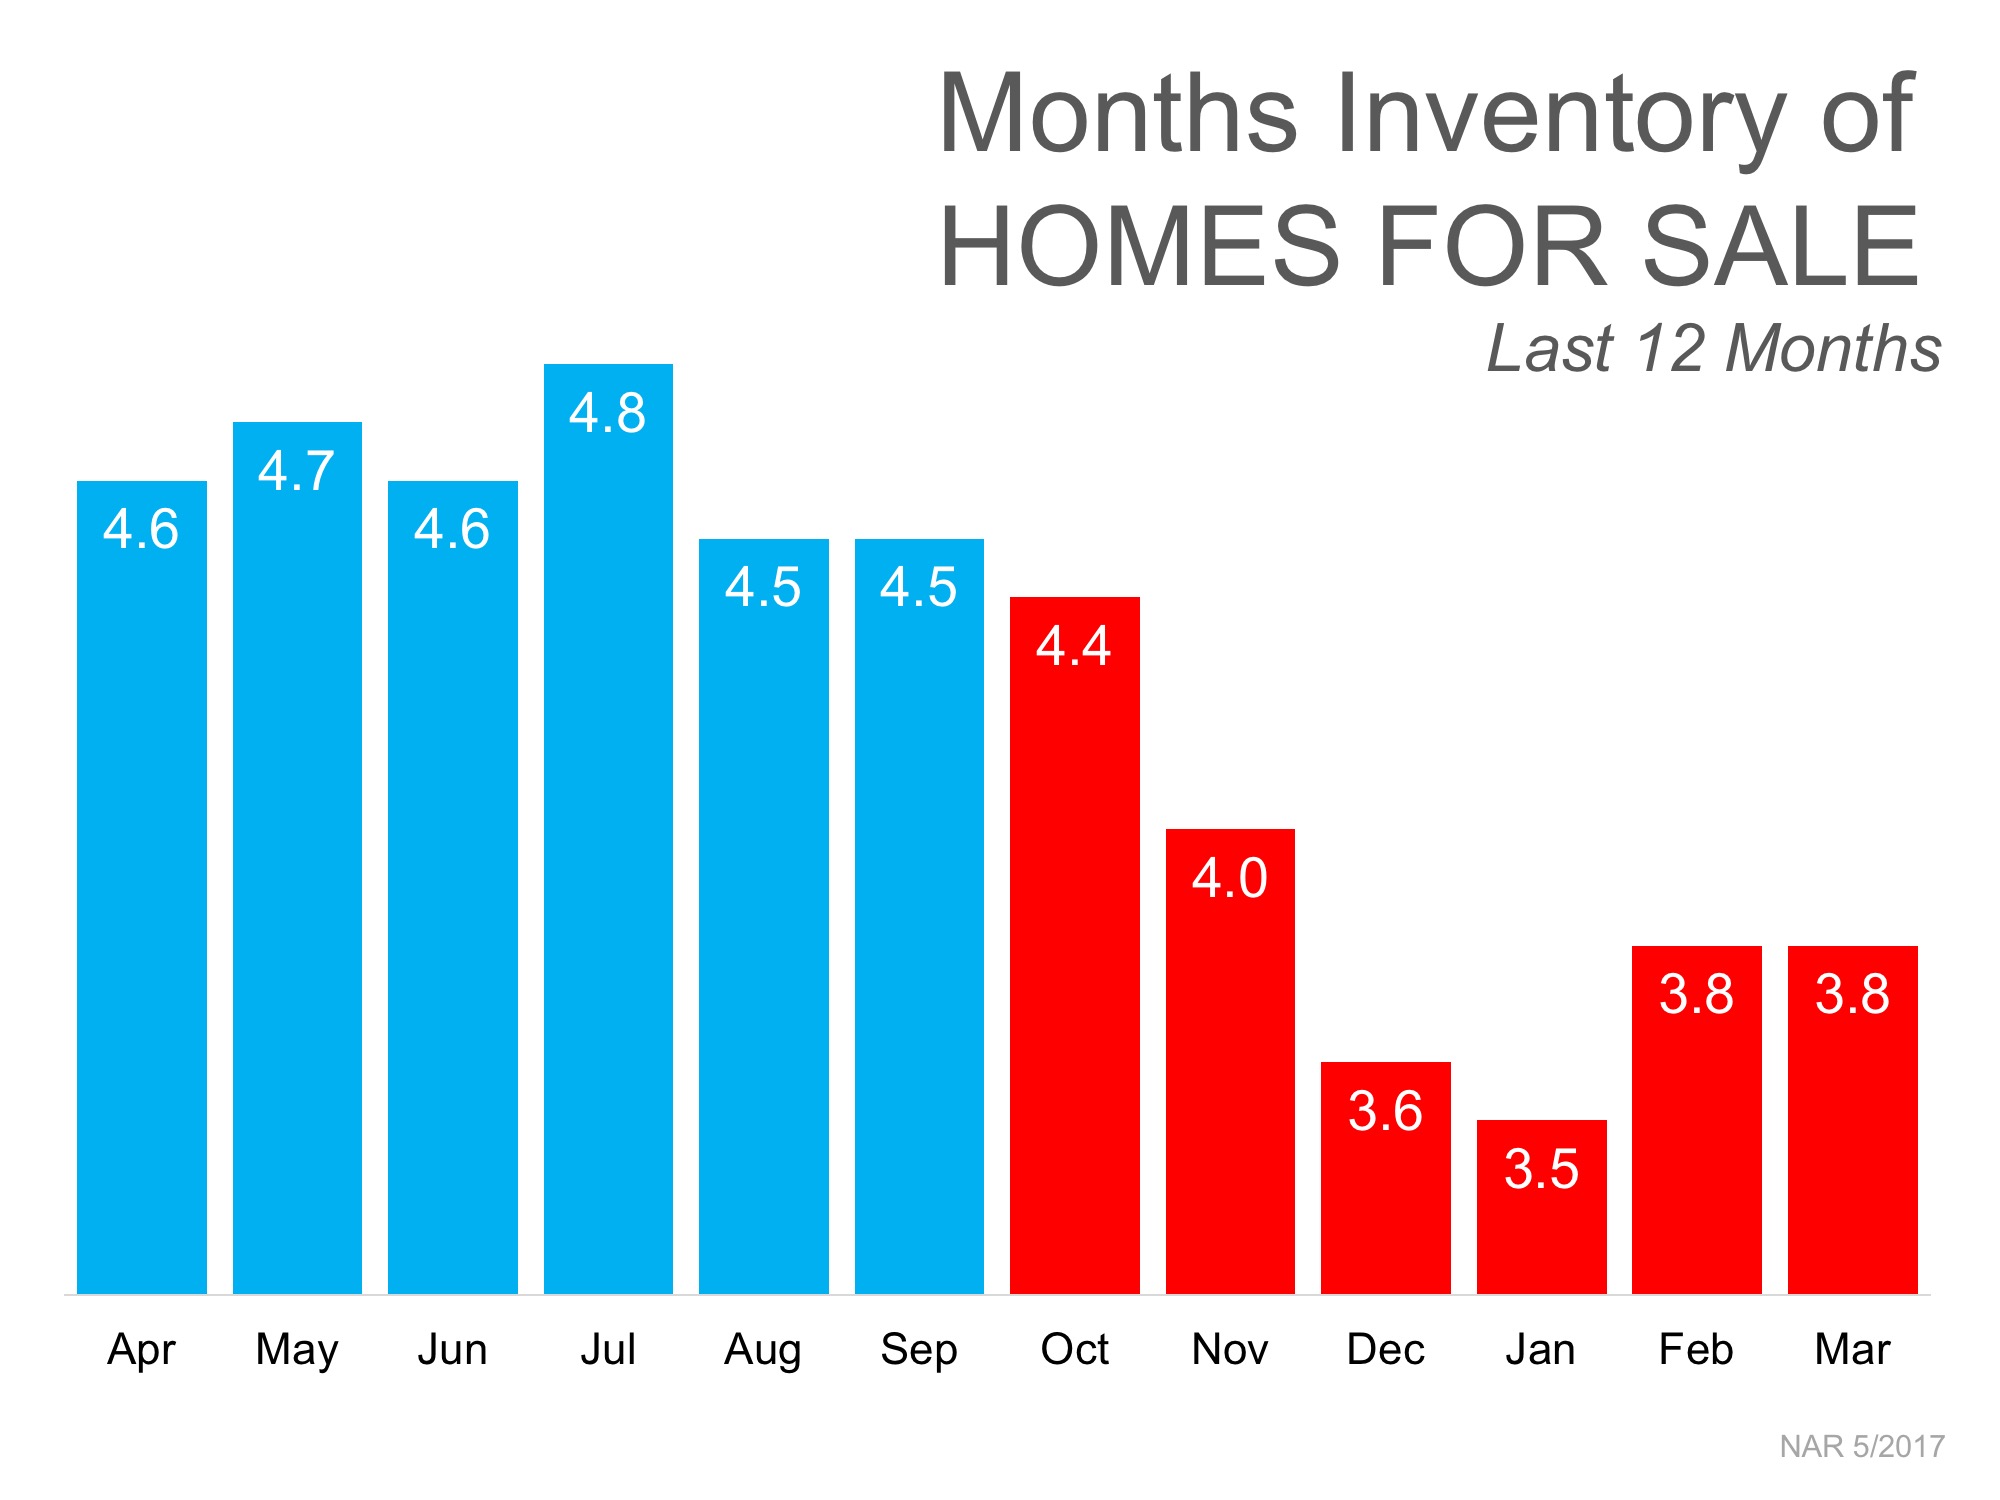
The National Association of Realtors (NAR) recently reported that the inventory of homes for sale stands at a 3.8-month supply. This is considerably lower than the 6-month supply necessary for a normal market.

3 Charts That Shout, ‘List Your Home Today!’ | MyKCM


DEMAND

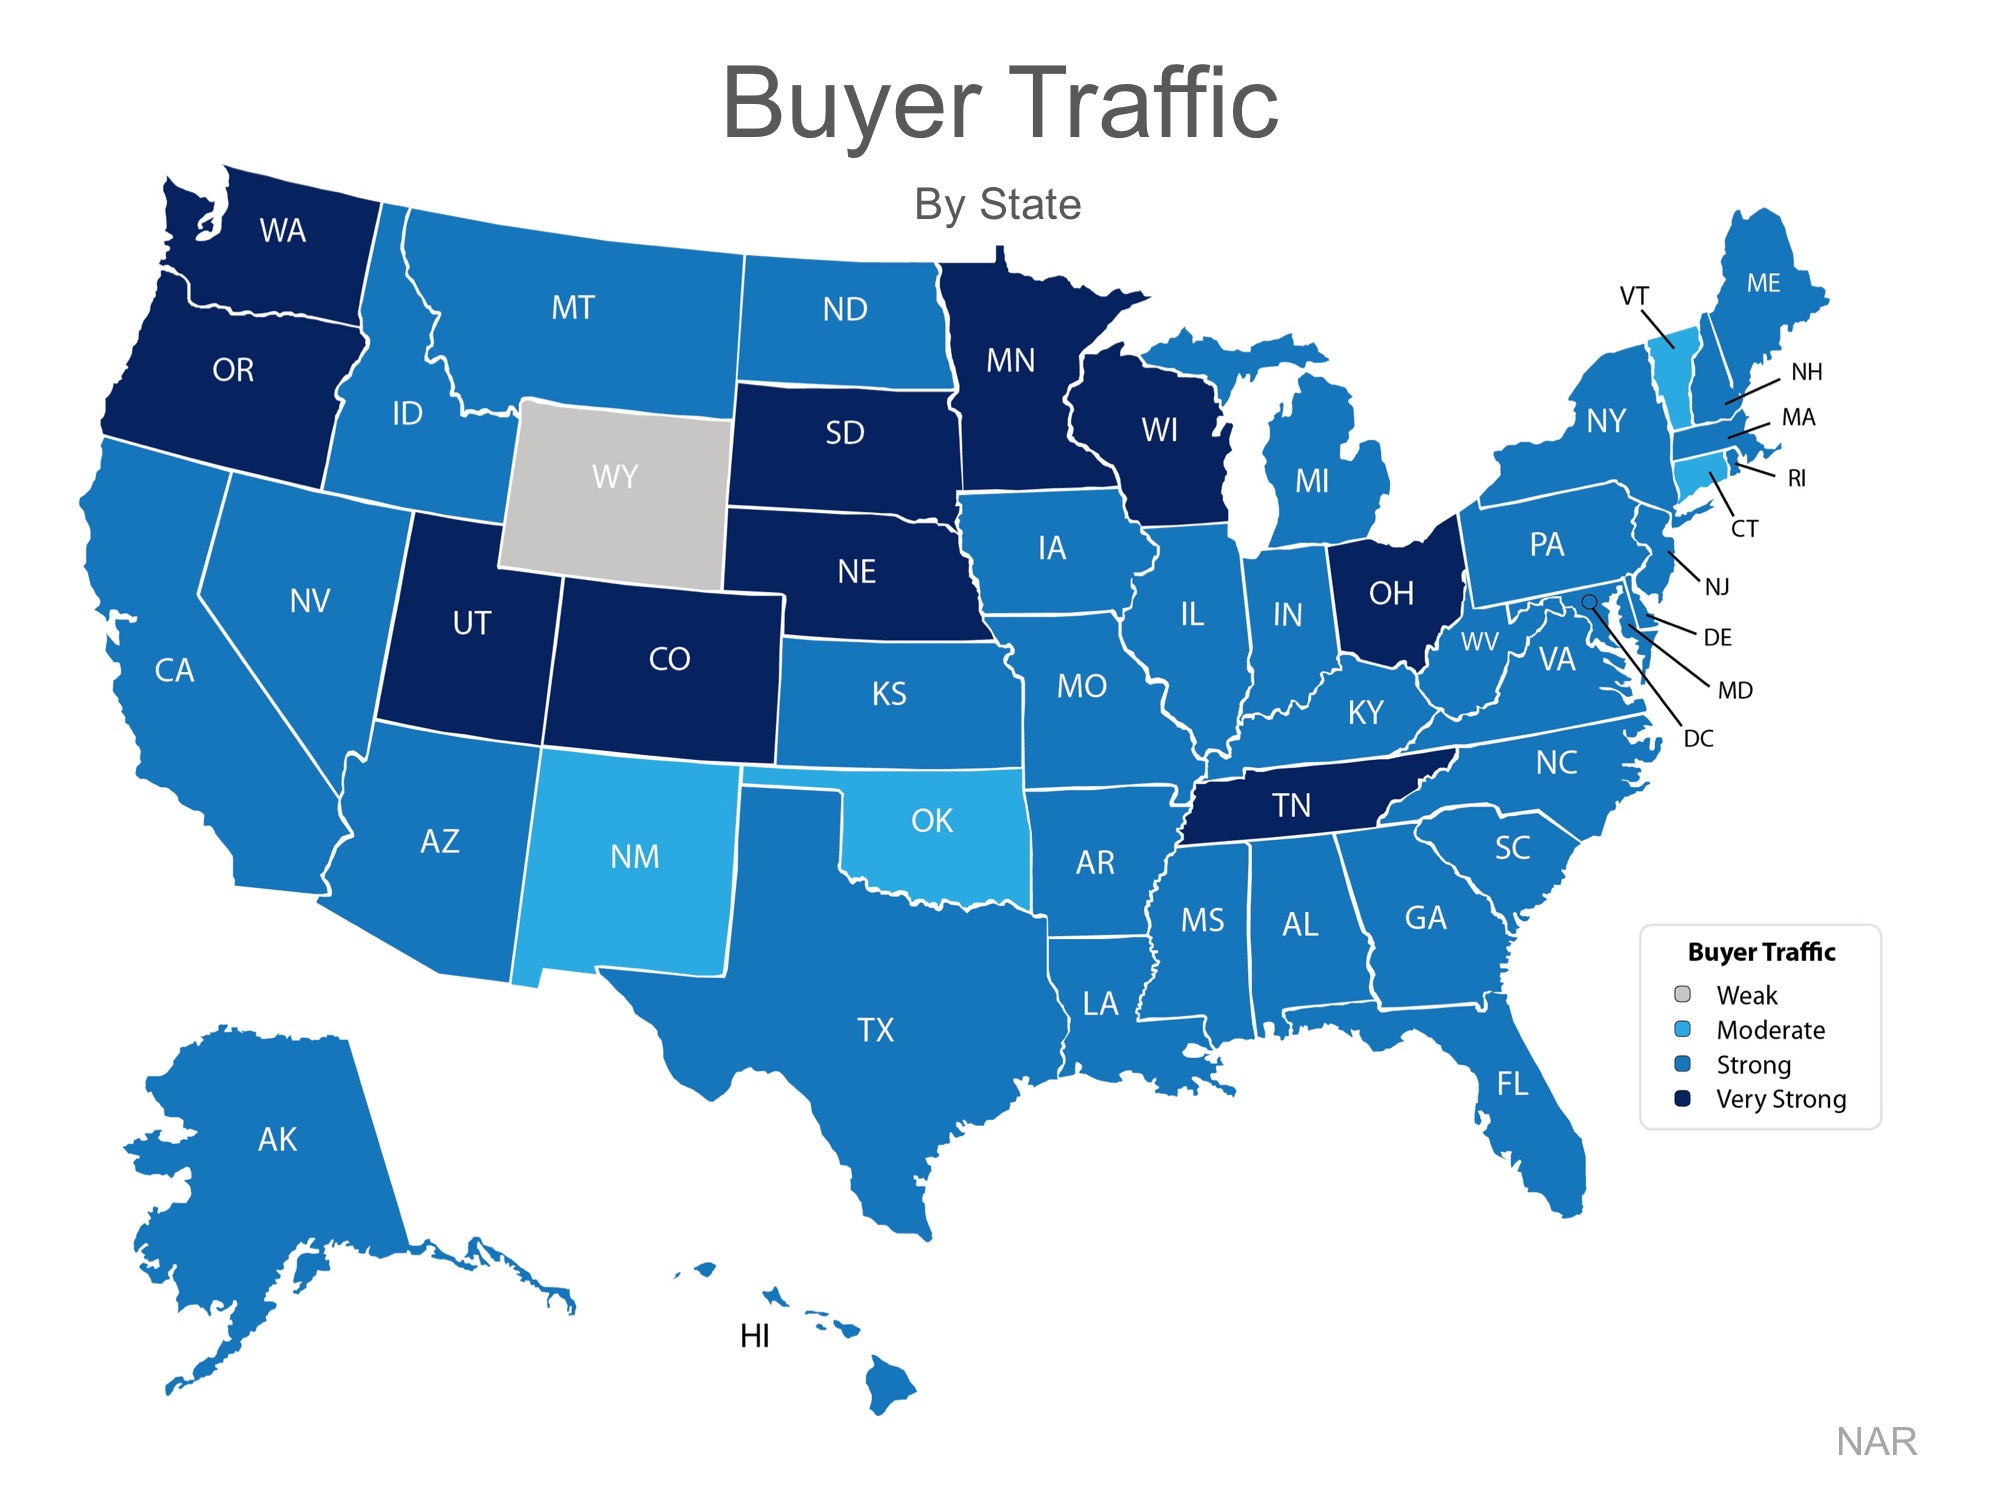
Every month NAR reports on the number of buyers out in the market looking for homes, which is also known as buyer traffic. As seen on the map below, buyer demand in March was strong or very strong in 45 out of 50 states nationwide, and Washington, DC.

3 Charts That Shout, ‘List Your Home Today!’ | MyKCM

Many buyers are being confronted with a very competitive market in which they must compete with other buyers for their dream homes (if they are even able to find a home they wish to purchase).

Listing your house for sale now will allow you to capitalize on the shortage of homes for sale in the market, which will translate into a better pricing situation.

HOME EQUITY

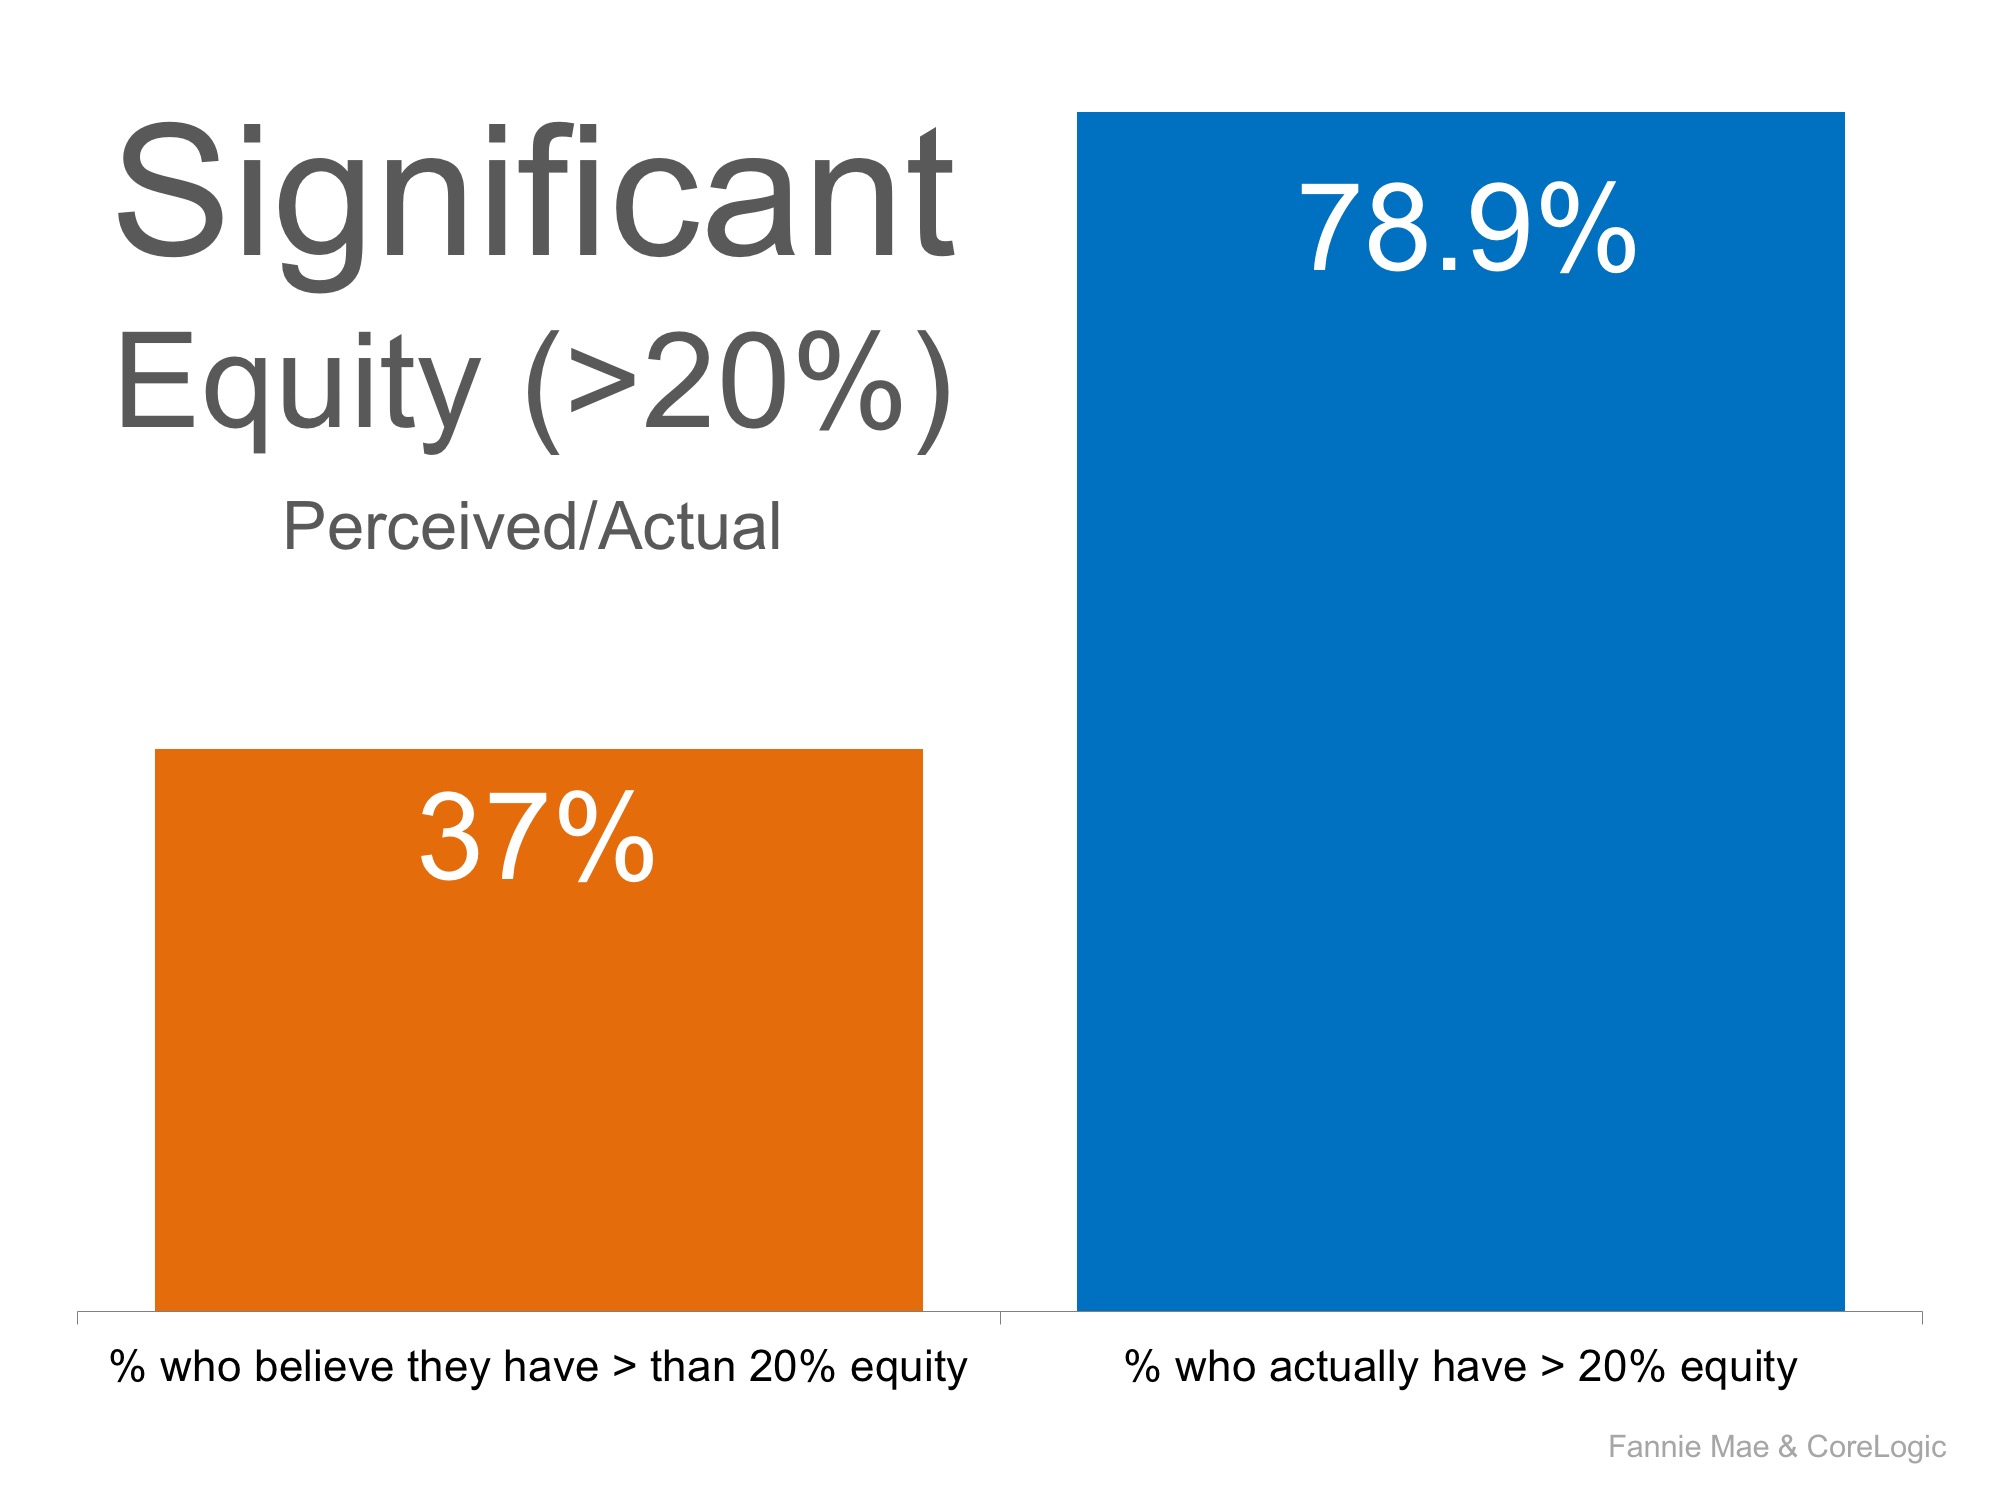
Many homeowners underestimate the amount of equity they currently have in their homes. According to a recent Fannie Mae study, 37% of homeowners believe that they have more than 20% equity in their homes. In reality, CoreLogic’s latest Equity Report tells us that 78.9% actually do!

3 Charts That Shout, ‘List Your Home Today!’ | MyKCM

Many homeowners who are undervaluing the equity they have in their homes may feel trapped, which may be contributing to the lack of inventory in the market.