We are very proud of our brokers to support the Windermere Foundation which has raised over $35 million since 1989. In 2017, Eastside offices alone, raised up to $225,000 to help 22 organizations on the Eastside.
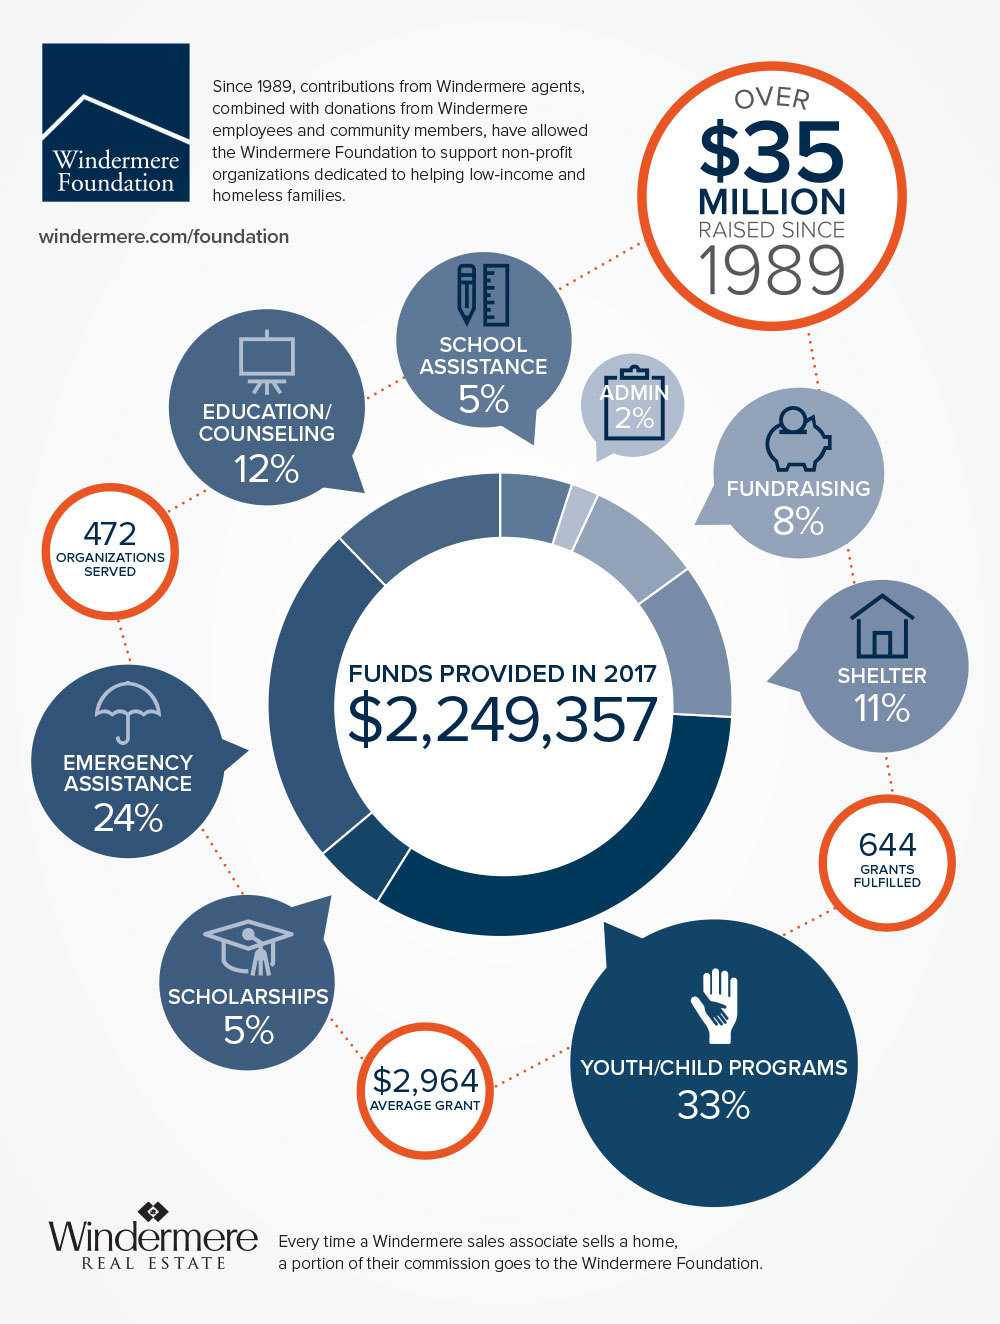
The Windermere Foundation had another banner year in 2017, raising even more than it did the prior year thanks to the continued support of Windermere franchise owners, agents, staff, and the community. Over $2.4 million was raised in 2017, which is an increase of eight percent over the previous year. This brings our total to over $35.5 million raised since the start of the Windermere Foundation in 1989.
A portion of the money raised last year is thanks to our agents who each make a donation to the Windermere Foundation from every commission they earn. Additional donations from Windermere agents, the community, and fundraisers made up 66% of the money collected in 2017. These funds enable our offices to support local non-profits that provide much-needed services to low-income and homeless families in their communities.
SUMMARY OF FUNDS, GRANTS & DONATIONS IN 2017
Organizations served: 472
Number of individual grants fulfilled: 644
Average grant amount: $2,964.04
Average donation to the Windermere Foundation: $116.08
FUNDING BREAKDOWN
Total amount disbursed in 2017: $2,249,357.14
Total disbursed through grants: $1,908,843.54
Scholarships: 5%
Youth/Child Programs: 33%
Emergency Assistance: 24%
Shelter: 11%
School Assistance: 5%
Education/Counseling: 12%
Administrative Expenses: 2%
Fundraising Expenses: 8%
So how are Windermere Foundation funds used? Windermere offices decide for themselves how to distribute the money in their local community. Our offices have helped support school lunch and afterschool programs, housing assistance for homeless families, food banks, homeless shelters, and non-profits that provide basic necessities, such as shoes, clothing, toiletries, and blankets to families in need.
A very notable day in 2017 for the Windermere Foundation was November 15, when a record-breaking $253,782 was given in a single day. A total of 35 non-profit organizations benefitted from that day’s donations, including Attain Housing in Kirkland, WA, which received $56,000 from the Windermere Eastside offices. Other organizations that received donations were Boys and Girls Club of Contra Costa in Walnut Creek, CA, and the Shady Cove School in Shady Cove, Oregon.
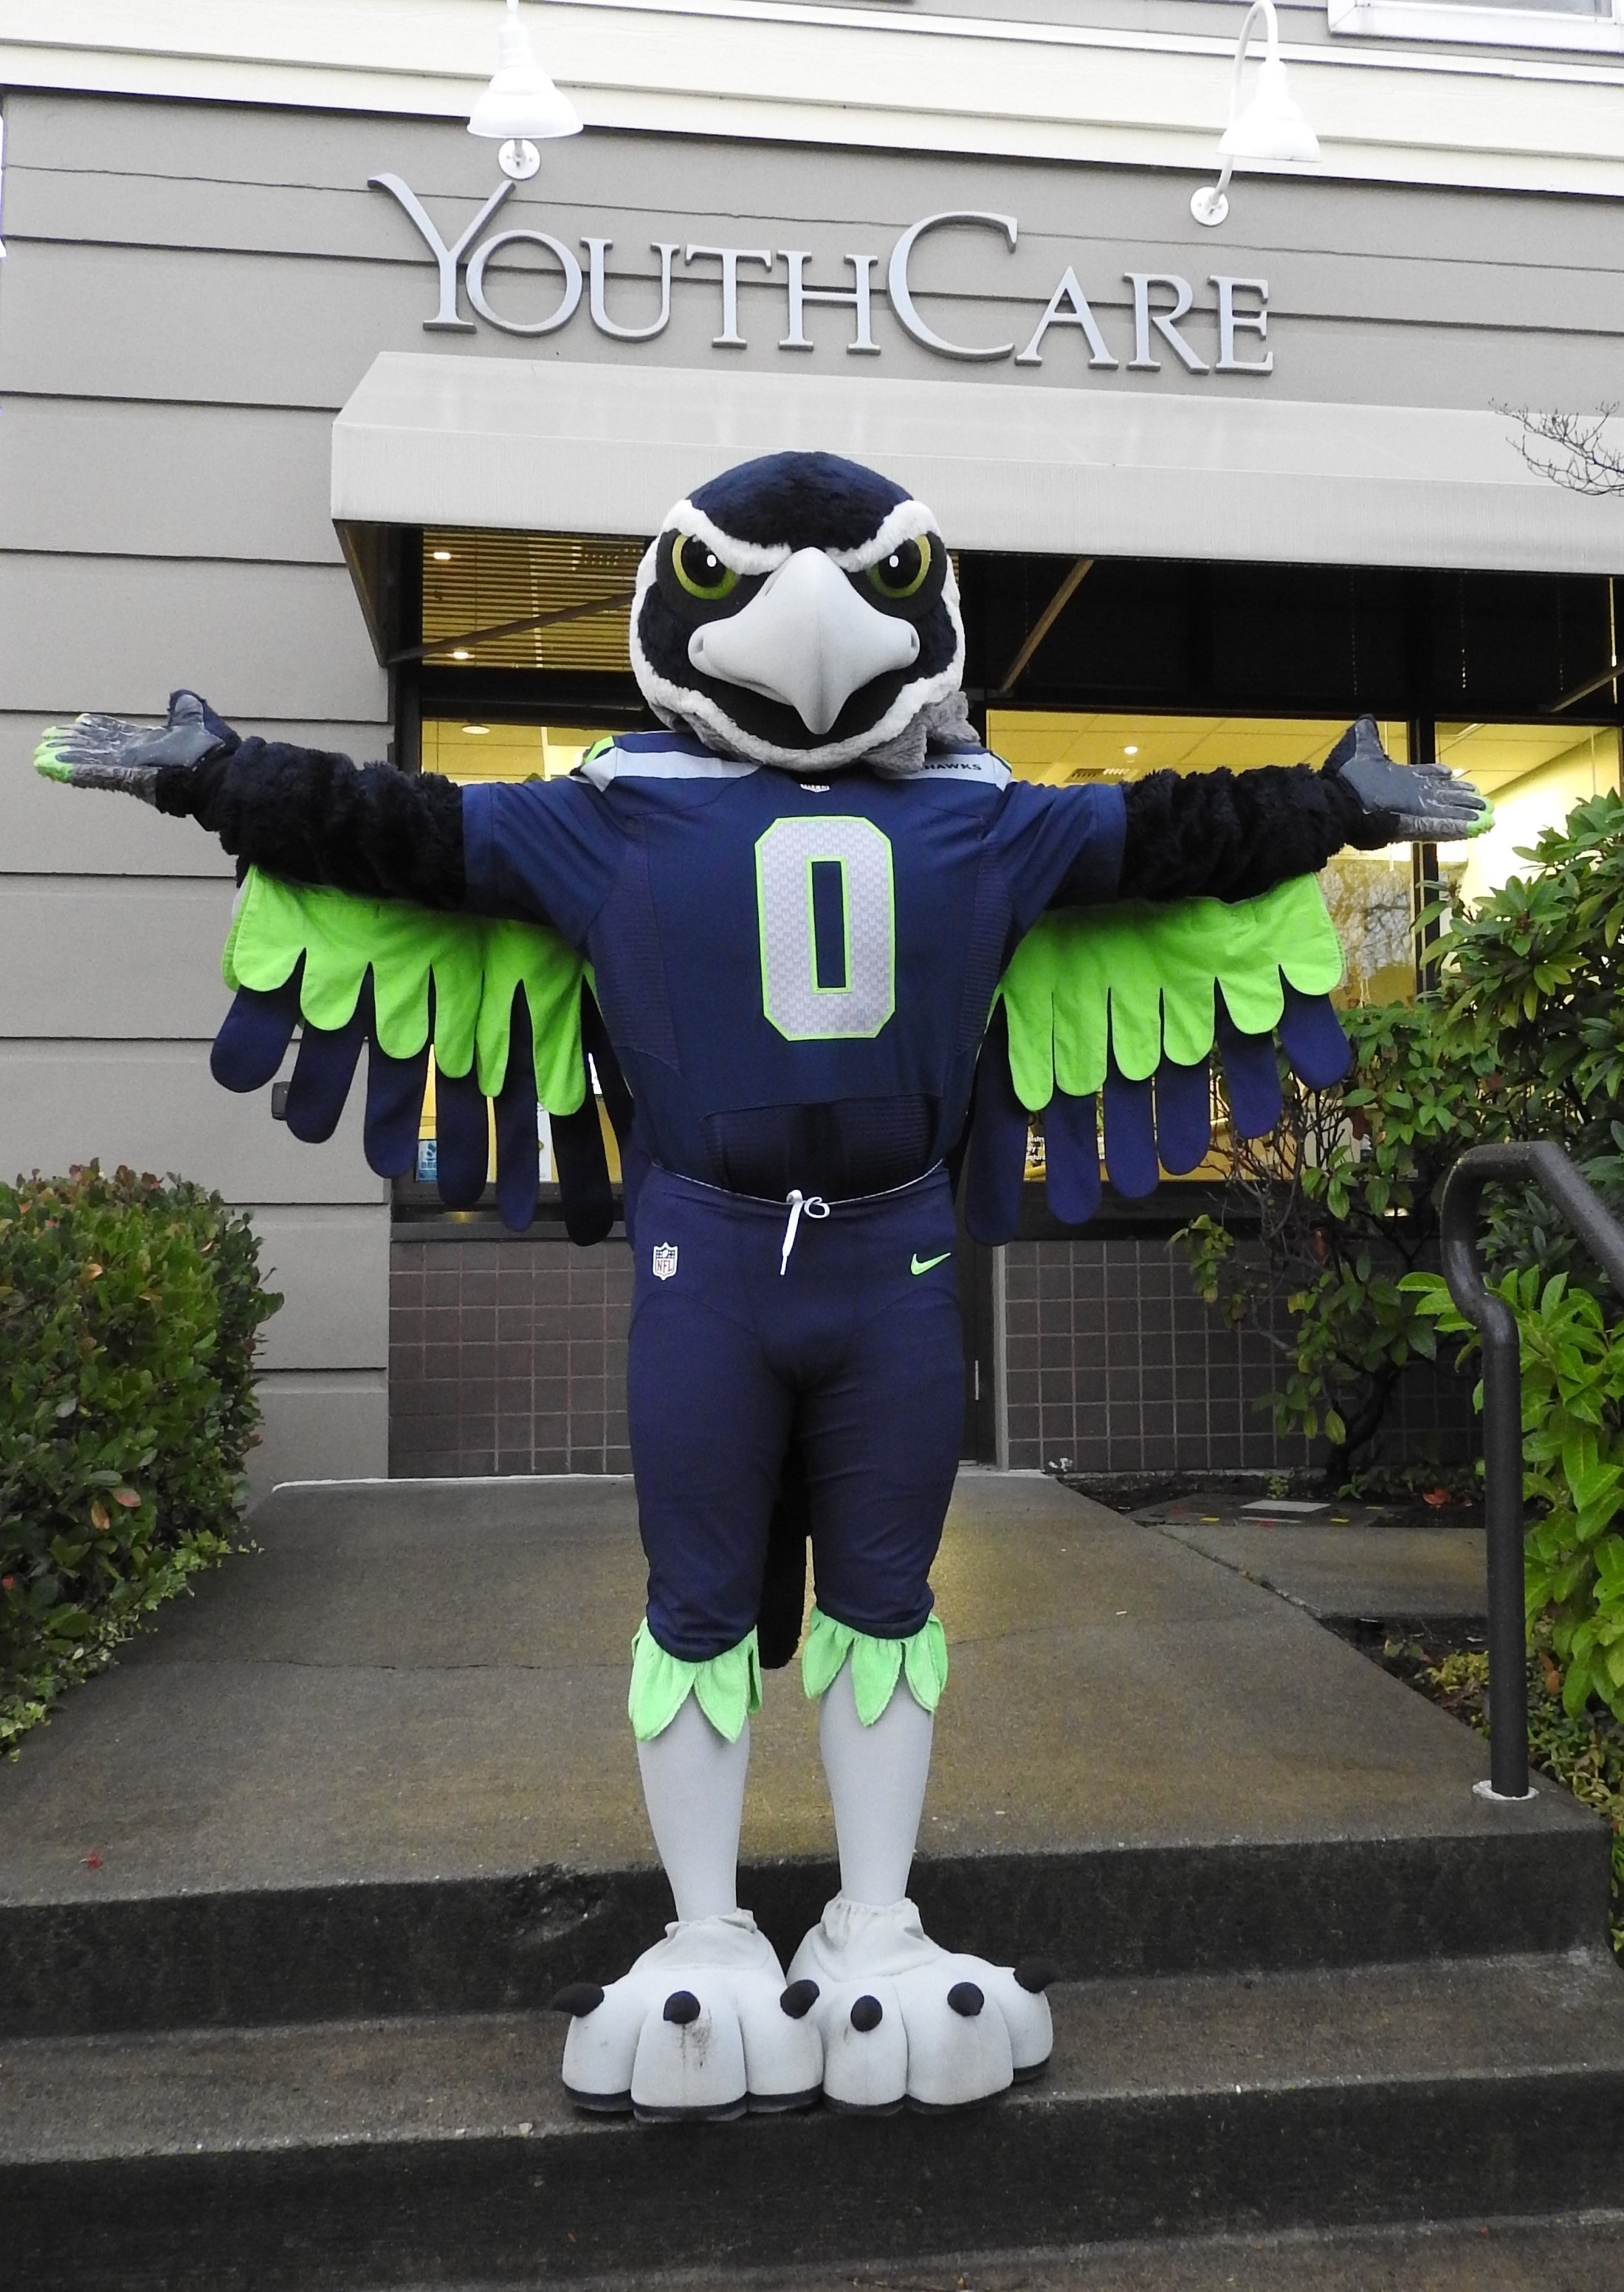
2017 also marked the second year of our #tacklehomelessness campaign with the Seattle Seahawks, in which Windermere committed to donating $100 for every Seahawks home game defensive tackle to YouthCare, a non-profit organization that provides critical services to homeless youth. While the Seahawks didn’t make it to the playoffs this year, they did help us raise $31,800. When added to last year’s $35,000, that’s a total donation of $66,800. We are grateful for the opportunity to provide additional support to homeless youth thanks to the Seahawks, YouthCare, and the #tacklehomelessness campaign.
Thanks to our agents and everyone who supports the Windermere Foundation, we are able to continue to make a difference in the lives of many families in our local communities. If you’d like to help support programs in your community, please click the Donate button.
Windermere Eastside brokers donated $225,000 in 2017
In 2017, 22 organizations on the Eastside were granted $225,000 thanks to Windermere Eastside brokers. The grants help our Eastside community in various ways from providing school supplies and meals to housing needs.
The list of grant recipients
Acres of Diamonds – $4,000. This grant provides women and children transitional housing and support programs to rebuild lives from domestic abuse and/or substance abuse.
Assistance League – $15,000. This grant goes to the Operation School Bell program that provides basic items of clothing to low-income students, grades K-12.
Attain Housing – $56,000. This grant provides affordable housing to homeless families with children as well as case management for setting financial and social goals.
Backpack Meals – $10,000. This grant provides weekend meals to Bellevue School District students who are homeless and would otherwise go hungry.
Bellevue LifeSpring – $31,000. This grant supports the Breaktime-Mealtime Program which provides 80,000 meals to children during school breaks.
Boys and Girls Club of Bellevue – $7,500. This grant supports Project Learn after school and summer camp programs at three low-income housing Clubhouses.
Eastside Academy – $6,000. This grant pays food expenses for homeless and poverty-level students while they attend this alternative high school.
Eastside Baby Corner – $20,000. This grant provides essentials like diapers and formula to economically disadvantaged children, from birth to age 12.
Escape to Peace– $2,500. This grant helps create awareness of sex trafficking of Eastside minors and helps fund a healing center – a safe place for children to escape and to provide healing.
Friends of Youth– $2,500. This grant helps fund emergency response and shelter, then long-term placement, to children (ages 7-17) experiencing trauma or abuse in east King County.
Hopelink– $2,300. This grant supports the Pantry Pack Program which provides lunches to poverty-level children in the 36 Lake Washington School District schools.
Imagine Housing – $5,000. This grant will target under 18-year olds in their Support Services Program that provides affordable housing and life skill case management in East King County.
Issaquah Community Services – $2,500. This grant will provide emergency aid in the form of utility payments to low-income families in the Issaquah School District.
Issaquah Food Bank – $2,500. This grant helps maintain a refrigerated box truck utilized as a mobile food bank to remote Eastside communities that have difficulty accessing food bank services.
Kindering – $3,000. This grant provides developmental support, screening, and early intervention therapies to the very young children of homeless families.
Lifewire – $20,000. This grant supports the Hotel-Motel Voucher Program, which provides emergency short-term stays in hotels and motels for victim of domestic violence.
Mamma’s Hands – $15,000. This grant supports three Houses of Hope that house mothers and children from abuse and homelessness and helps them develop individual plans to bring changes to their lives.
Pantry Packs– $3,700. This grant supports the Lake Washington Schools Foundation’s program that provides weekend, child-friendly food packs to children of qualified low-income families.
Royal Family Kids Camp – $6,000. This grant supports summer camp for abused, neglected and abandoned foster children (ages 7-11).
Treehouse – $3,000. This grant supports the Little Wishes Program which allows foster care youth to participate in extracurricular arts, athletics, and other educational experiences.
Village Theatre– $2,500. This grant helps the Theatre’s outreach to the youth of low-income families so they can have access to theatre and arts education, regardless of their ability to pay.
Youth Eastside Services – $5,000. This grant supports YES Lifeline, which provides free mental health counseling and substance abuse treatment to low-income East King County youth and families.
Windermere Bellevue Commons collects nearly 60 items for homeless youth!
We would like to take a moment and thank all of our agents and staff who participated in Windermere’s Winter Drive: “We’ve Got You Covered” benefiting YouthCare! Our office collected 58 items including new hats, scarves, gloves/mittens and warm socks for homeless youth.
As part of Windermere’s #tacklehomelessness campaign with the Seattle Seahawks, 37 Windermere offices* in King and Snohomish Counties participated in Windermere’s “We’ve Got You Covered” winter drive. The recipient of these donations was YouthCare, a Seattle-based non-profit that provides critical services and support to homeless youth throughout the Puget Sound area.
Over 3,000 items were collected during the four-week drive, which included some 737 pairs of socks, 391 hats, 467 pairs of gloves/mittens, 111 scarves, and an assortment of other accessories and cash donations.
The folks at YouthCare were all very thankful to receive the delivery of eight bins full of donated items. And to make the day even more exciting, Blitz, the Seahawks mascot, was on site to oversee the delivery of the items to YouthCare!
The Washington State economy added 79,600 new jobs over the past 12 months—an impressive growth rate of 2.4%, and well above the national growth rate of 1.2%. However, as we anticipated in last quarter’s report, we continue to see a modest slowdown in the growth rate as the state grows closer to full employment. Growth has been broad-based, with expansion in all major job sectors other than Aerospace (a function of a slowdown at Boeing). Given the current rate of expansion, I am raising my employment forecast and now predict that Washington will add 81,000 new jobs in 2017.
Given the robust job market, it is unsurprising that the state unemployment rate continues to fall. The current unemployment rate in Washington State is 4.6% and we are essentially at full employment. Additionally, all counties contained within this report reported either a drop or stability in their unemployment rate from a year ago. I maintain my belief that the Washington State economy will continue to outperform the U.S. as a whole. Given such a strong expansion, we should also expect solid income growth across Western Washington.
HOME SALES ACTIVITY
There were 25,312 home sales during the third quarter of 2017. This is an increase of 3.6% over the same period in 2016.
Clallam County maintains its number one position for sales growth over the past 12 months. Only four other counties saw double-digit gains in sales. This demonstrates continuing issues with the low supply of listings. There were modest declines in sales activity in six counties.
The market remains remarkably tight with listing inventory down by 14.2% when compared to the third quarter of 2016. But inventory is up a significant 32% compared to the second quarter of this year. Pending sales rose by 5.2% over the same quarter a year ago, which suggests that closings in Q4 will still be robust.
The key takeaway from this data is that inventory is still very low, and the situation is unlikely to improve through the balance of the year.
HOME PRICES
Given tight supply levels, it is unsurprising to see very solid price growth across the Western Washington counties. Year-over-year, average prices rose 12.3% to $474,184. This is 0.9% higher than seen in the second quarter of this year.
With demand far exceeding supply, price growth in Western Washington continues to trend well above the longterm average. As I do not expect to see the new home market expand at any significant pace, there will be continued pressure on the resale market, which will cause home prices to continue to rise at above-average rates.
When compared to the same period a year ago, price growth was most pronounced in Grays Harbor County where sale prices were 20.1% higher than the third quarter of 2016. Nine additional counties experienced double-digit price growth.
Mortgage rates in the quarter continue to test the lows of 2017, and this is unlikely to change in the near-term. This will allow home prices to escalate further but I expect we will see rates start to rise fairly modestly in 2018, which could slow price growth.
DAYS ON MARKET
The average number of days it took to sell a home in the quarter dropped by eight days when compared to the same quarter of 2016.
King County continues to be the tightest market, with homes taking an average of 17 days to sell. Every county except San Juan saw the days on market drop from the same period a year ago.
This quarter, it took an average of 43 days to sell a home. This is down from the 51 days it took in the second quarter of 2016 and down by 8 days from the second quarter of this year.
At some point, inventory will start to grow and this will lead to an increase in the average time it takes to sell a house. However, I do not expect that to happen at any time soon. So we remain in a seller’s market.
CONCLUSIONS
This speedometer reflects the state of the region’s housing market using housing inventory, price gains, home sales, interest rates, and larger economic factors. For the third quarter of 2017, I have left the needle at the same point as the second quarter. Though price growth remains robust, sales activity has slowed very slightly and listings jumped relative to the second quarter. That said, the market is very strong and buyers will continue to find significant competition for accurately priced and well-located homes.
ABOUT MATTHEW GARDNER
Matthew Gardner is the Chief Economist for Windermere Real Estate, specializing in residential market analysis, commercial/industrial market analysis, financial analysis, and land use and regional economics. He is the former Principal of Gardner Economics, and has more than 30 years of professional experience both in the U.S. and U.K.
We’re excited to announce that our office is participating in Windermere’s ”We’ve Got You Covered” winter drive benefiting YouthCare.
We’re heading into the second season of our partnership with the Seattle Seahawks, and we are continuing our campaign to help #tacklehomelessness. For every home game tackle made by the Seahawks, the Windermere Foundation is donating $100 to YouthCare, a non-profit that provides support and services to homeless youth throughout the Puget Sound area.
BUT THERE IS MORE WE CAN DO!
We’re excited to hold another Windermere “We’ve Got You Covered” winter drive benefitting YouthCare. Each night in the greater Seattle area, nearly 1,000 young people are homeless. And with the winter months quickly approaching, YouthCare is in dire need of survival supplies to keep homeless youth warm and dry during the long, wet winter.
The following analysis of the Western Washington real estate market is provided by Windermere Real Estate Chief Economist Matthew Gardner. We hope that this information may assist you with making better-informed real estate decisions. For further information about the housing market in your area, please don’t hesitate to contact me.
ECONOMIC OVERVIEW
The Washington State economy has been expanding at a rapid pace but we are seeing a slowdown as the state grows closer to full employment. Given the solid growth, I would expect to see income growth move markedly higher, though this has yet to materialize. I anticipate that we will see faster income growth in the second half of the year. I still believe that the state will add around 70,000 jobs in 2017.
Washington State, as well as the markets that make up Western Washington, continue to see unemployment fall. The latest state-wide report now shows a rate of 4.5%—the lowest rate since data started to be collected in 1976.
I believe that growth in the state will continue to outperform the U.S. as a whole and, with such robust expansion, I would not be surprised to see more people relocate here as they see Washington as a market that offers substantial opportunity.
HOME SALES ACTIVITY
There were 23,349 home sales during the second quarter of 2017. This is an increase of 1.1% from the same period in 2016.
Clallam County maintains its position as number one for sales growth over the past 12 months. Double-digit gains in sales were seen in just three other counties, which is a sharp drop from prior reports. I attribute this to inventory constraints rather than any tangible drop in demand. The only modest decline in sales last quarter was seen in Grays Harbor County.
The number of homes for sale, unfortunately, showed no improvement, with an average of just 9,279 listings in the quarter, a decline of 20.4% from the second quarter of 2016. Pending sales rose by 3.6% relative to the same quarter a year ago.
The key takeaway from this data is that it is unlikely we will see a significant increase in the number of homes for sale for the rest of 2017.
HOME PRICES
Along with the expanding economy, home prices continue to rise at very robust rates. Year-over-year, average prices rose 14.9%. The region’s average sales price is now $470,187.
Price growth in Western Washington continues to impress as competition for the limited number of homes for sale remains very strong. With little easing in supply, we anticipate that prices will continue to rise at above long-term averages.
When compared to the same period a year ago, price growth was most pronounced in San Juan County where sale prices were 29.2% higher than second quarter of 2016. Eight additional counties experienced double-digit price growth.
The specter of rising interest rates failed to materialize last quarter, but this actually functioned to get more would-be buyers off the fence and into the market. This led to even more demand which translated into rising home prices.
DAYS ON MARKET
The average number of days it took to sell a home in the quarter dropped by 18 days when compared to the same quarter of 2016.
King County remains the tightest market; homes, on average, sold in a remarkable 15 days. Every county in this report saw the length of time it took to sell a home drop from the same period a year ago.
Last quarter, it took an average of 48 days to sell a home. This is down from the 66 days it took in the second quarter of 2016.
Given the marked lack of inventory, I would not be surprised to see the length of time it takes to sell a home drop further before the end of the year.
CONCLUSIONS
This speedometer reflects the state of the region’s housing market using housing inventory, price gains, home sales, interest rates, and larger economic factors. For the second quarter of 2017, I moved the needle a little more in favor of sellers. To define the Western Washington market as “tight” is somewhat of an understatement. Inventory is short and buyers are plentiful. Something must give, but unless we see builders delivering substantially more units than they have been, it will remain staunchly a sellers’ market for the balance of the year. Furthermore, increasing mortgage rates have failed to materialize and, with employment and income growth on the rise, the regional housing market will continue to be very robust.
ABOUT MATTHEW GARDNER
Matthew Gardner is the Chief Economist for Windermere Real Estate, specializing in residential market analysis, commercial/industrial market analysis, financial analysis, and land use and regional economics. He is the former Principal of Gardner Economics, and has more than 30 years of professional experience both in the U.S. and U.K.
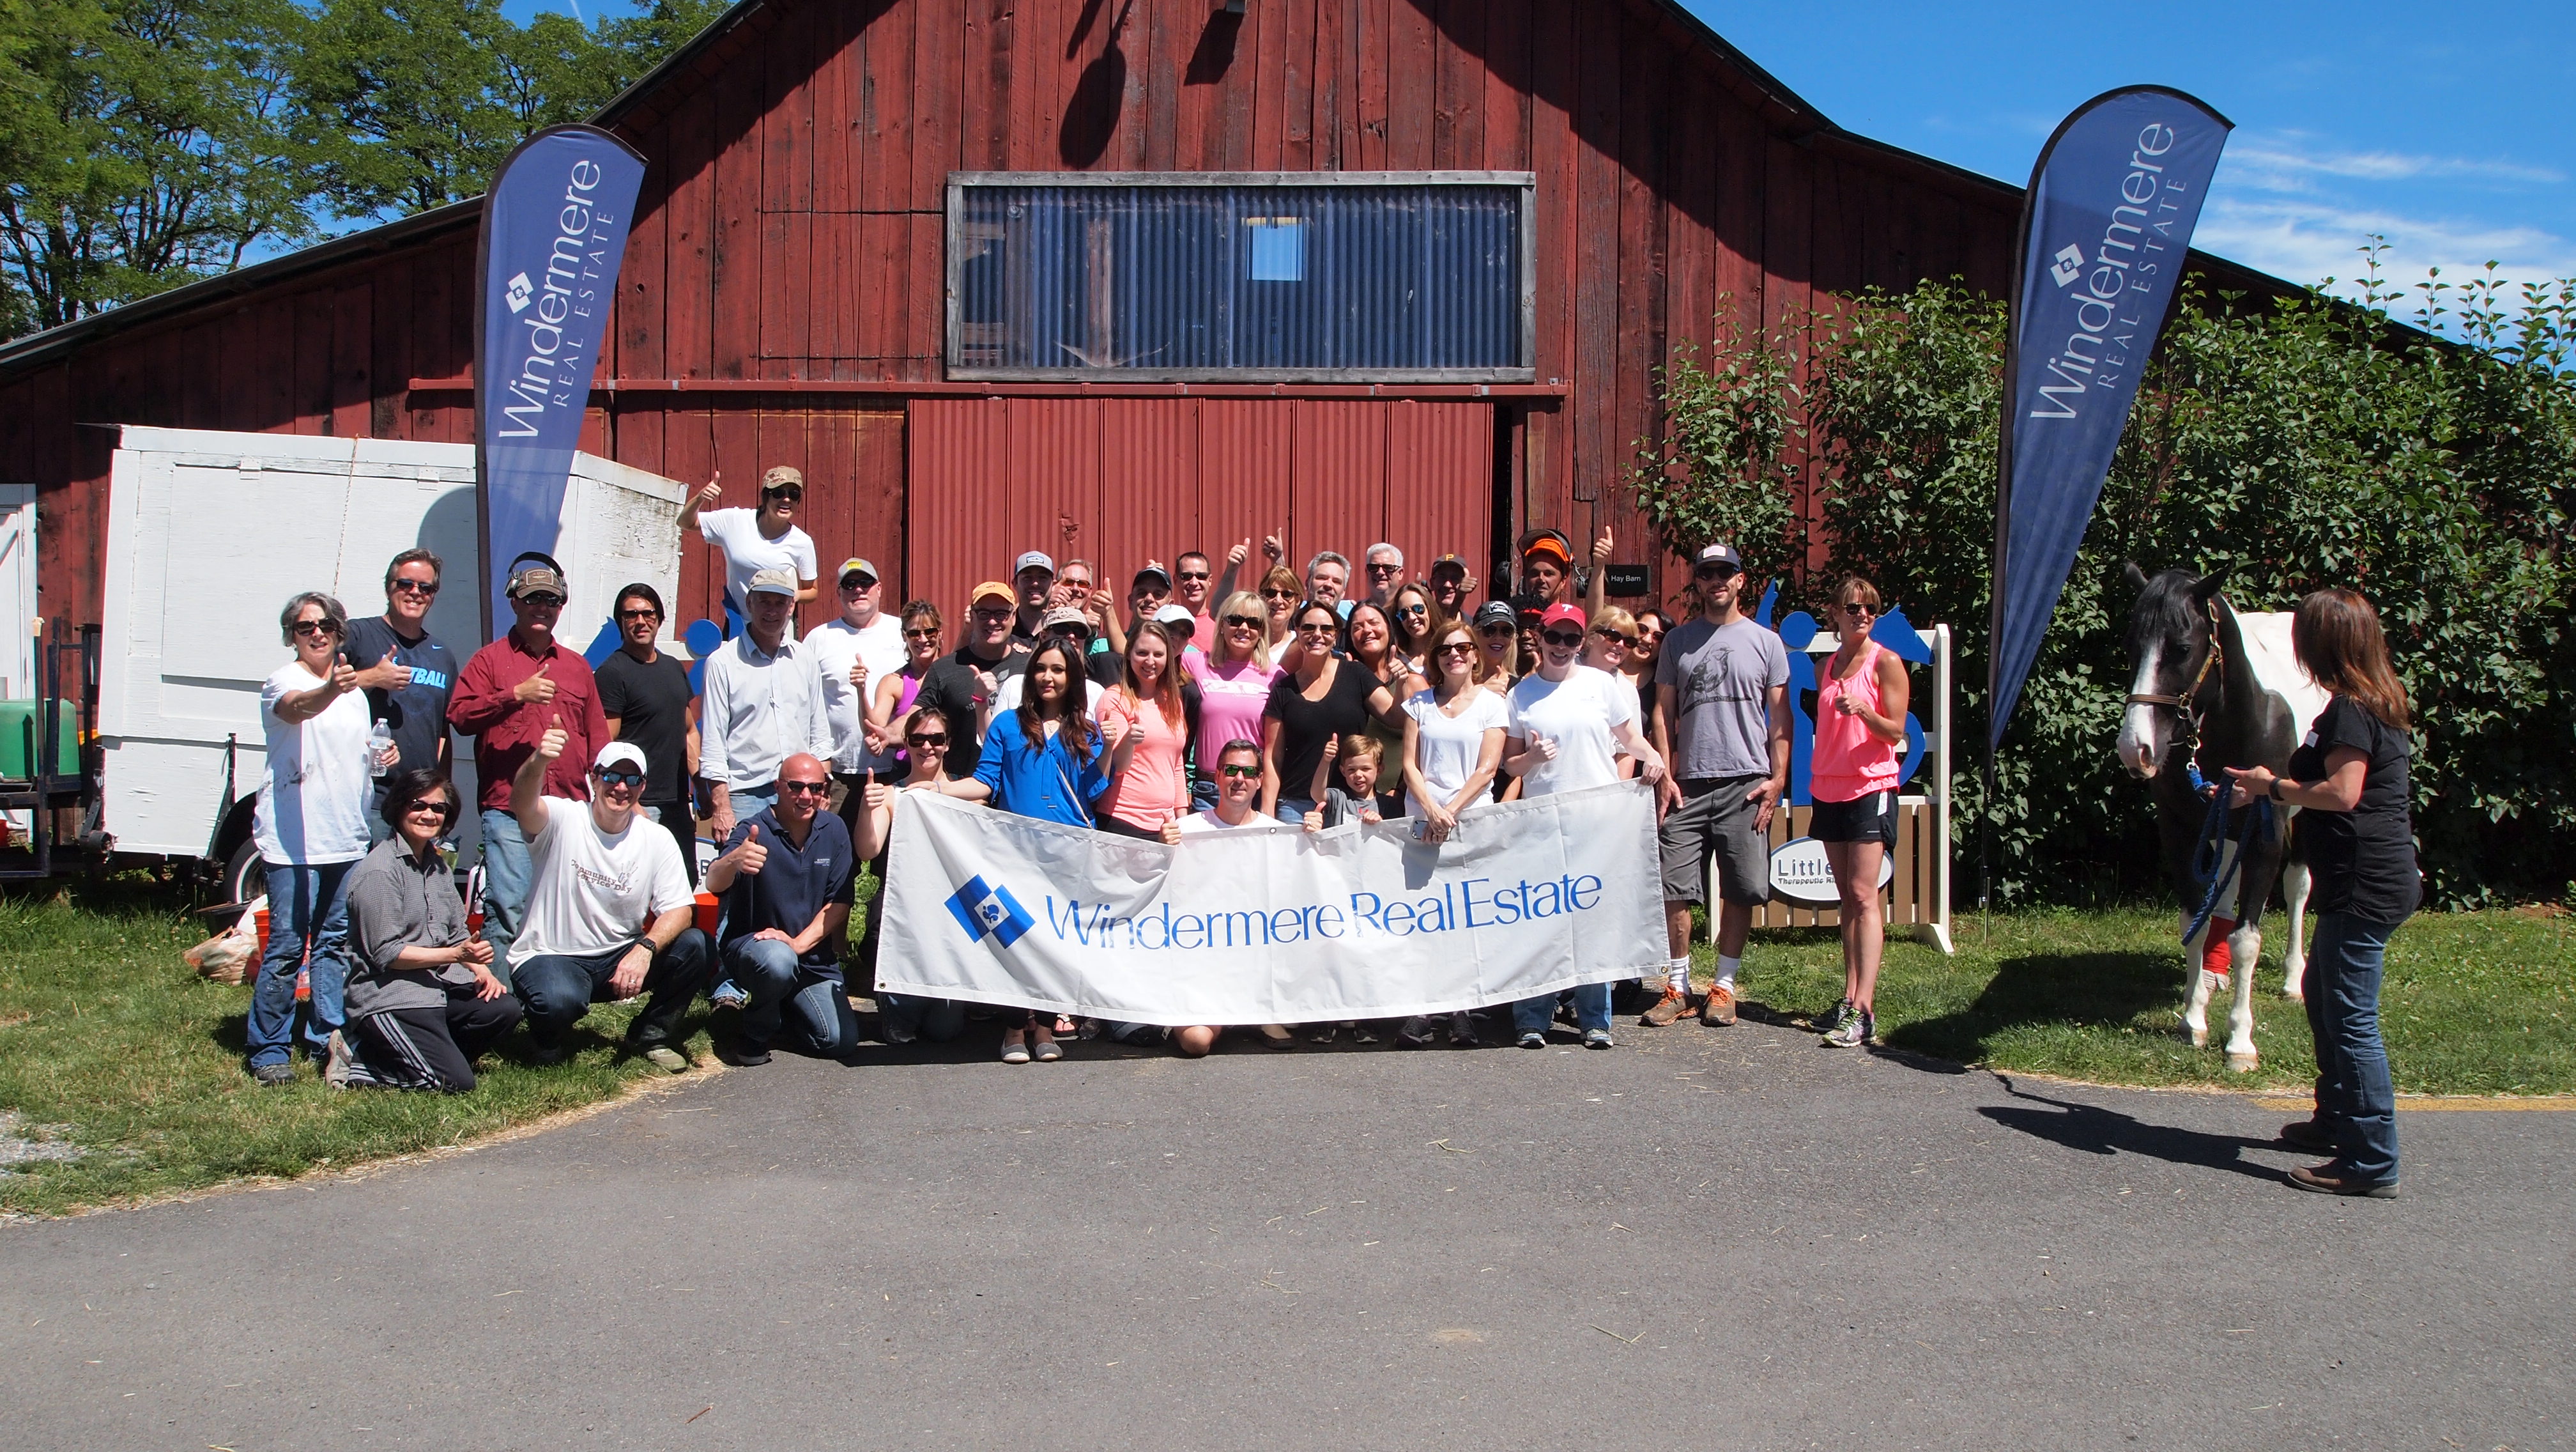
This year Windermere Community Service Day is on June 9th, 2017. On this day, our brokers and staff at Bellevue Commons will be doing a variety of projects at Little Bit Therapeutic Riding Center; we’ve been volunteering at this great organization for the past 17 years.
Last year we painted the caretaker’s home (the whole house!), took care of rain garden maintenance, weed whacked, and washed windows. The brokers also washed the horses’ paddock fencing and arena fencing.
Little Bit Therapeutic Riding Center improves the bodies, minds, and spirits of children and adults with disabilities through equine-assisted therapies and activities, and to be an inspiration and educational resource to the therapeutic riding profession, both regionally and nationally.
The City of Bellevue has started the construction of Meydenbauer Bay Park. We’re excited to see how it would improve the connection between Bellevue’s bustling downtown and its scenic Lake Washington waterfront.
With a quarter mile of waterfront, the 10-acre park considerably expands the current Meydenbauer Bay Beach Park. A large public swimming beach, pedestrian pier, historic whaling building and new beach house will make the park a destination for residents and visitors.
“We are one step closer to fulfilling a 30-year council vision,” said Mayor John Stokes. “This project is a testament to the patience and tenacity of city leaders who wouldn’t give up on their dream of increasing waterfront access and connections to the heart of our city.”
Key elements of the project include:
Relocation and expansion of the public swimming beach
Construction of a new beach house with restrooms and showers
A curvilinear pedestrian pier and hand-carry boat launch
Pedestrian, pathways and picnic areas
Remodeling the historic Whaling Building to include accessible restrooms, a small meeting room and boat rentals
Shoreline restoration to improve ecological functions
Parking and overlooks
Meydenbauer Bay, the site of a small village in the early 1900s, has a rich history. From 1914 to 1952, the inlet was the off-season home to a whaling fleet that plied Puget Sound.
The new park responds to the community’s long-held interest in additional public water access. Despite Bellevue’s 14 miles of shoreline along Lake Washington and Lake Sammamish, total shoreline in public ownership is limited to approximately 1.6 miles, or 12 percent, with the majority along Lake Washington.
IMCO General Construction will work primarily west and northwest of 99th Avenue Northeast to connect with and expand the existing park between Lake Washington Boulevard and the Meydenbauer Bay shoreline. Meydenbauer Beach Park will be closed during the project, and the Bellevue Marina will remain open.
Construction is expected to be completed in late fall 2018.
In school, we all learned the theory of supply and demand. When the demand for an item is greater than the supply of that item, the price will surely rise.
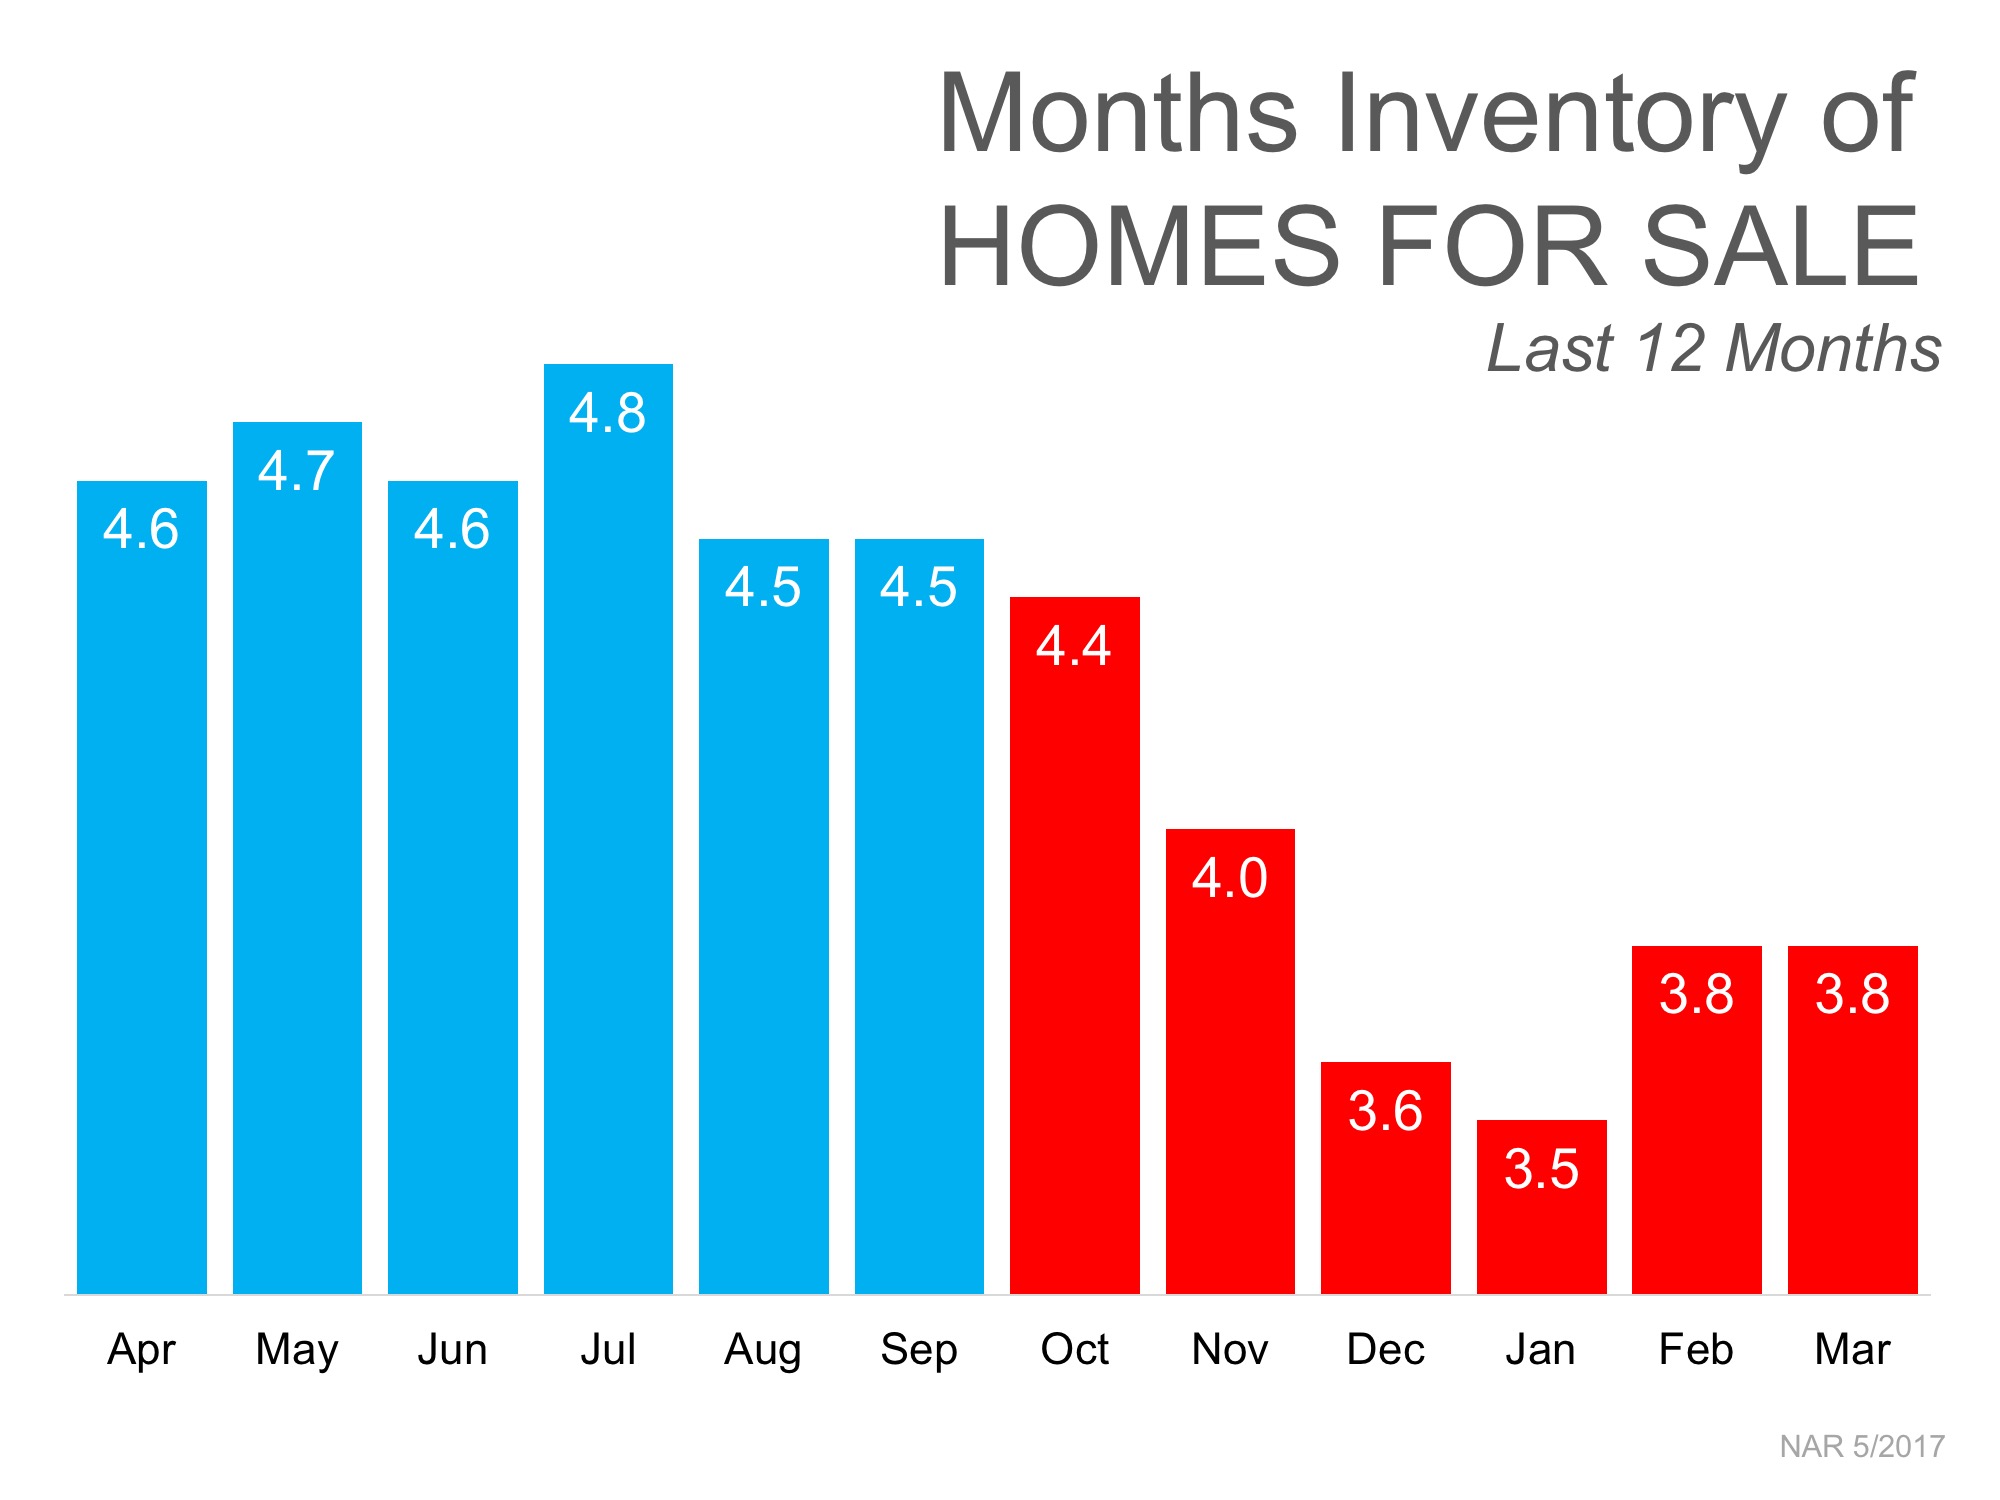
SUPPLY
The National Association of Realtors (NAR) recently reported that the inventory of homes for sale stands at a 3.8-month supply. This is considerably lower than the 6-month supply necessary for a normal market.
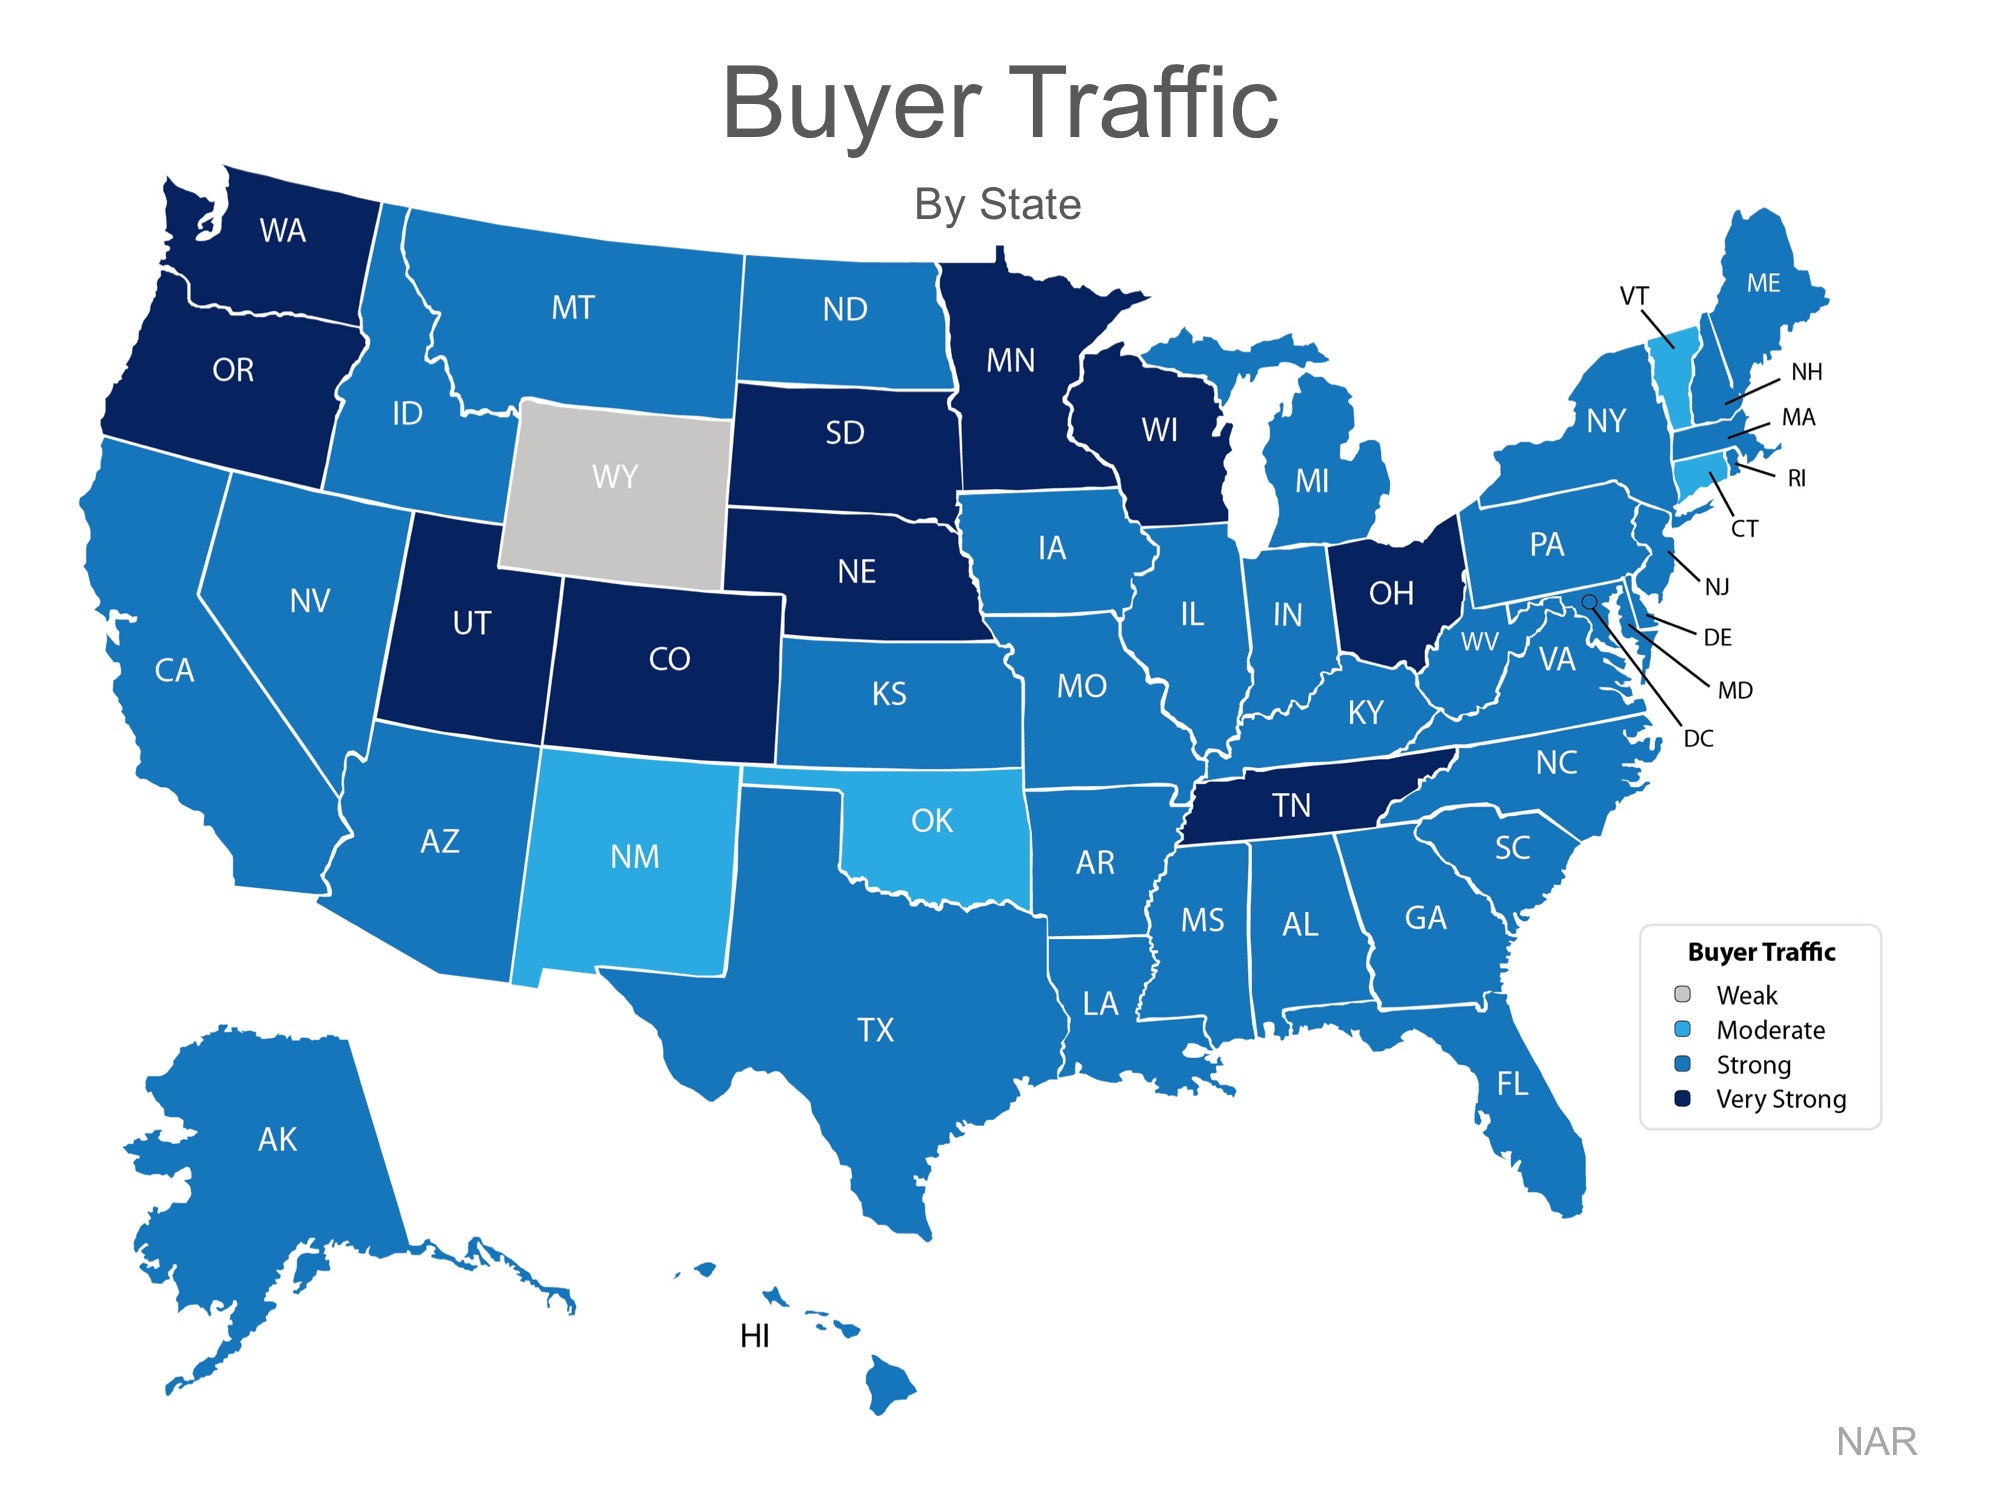
DEMAND
Every month NAR reports on the number of buyers out in the market looking for homes, which is also known as buyer traffic. As seen on the map below, buyer demand in March was strong or very strong in 45 out of 50 states nationwide, and Washington, DC.
Many buyers are being confronted with a very competitive market in which they must compete with other buyers for their dream homes (if they are even able to find a home they wish to purchase).
Listing your house for sale now will allow you to capitalize on the shortage of homes for sale in the market, which will translate into a better pricing situation.
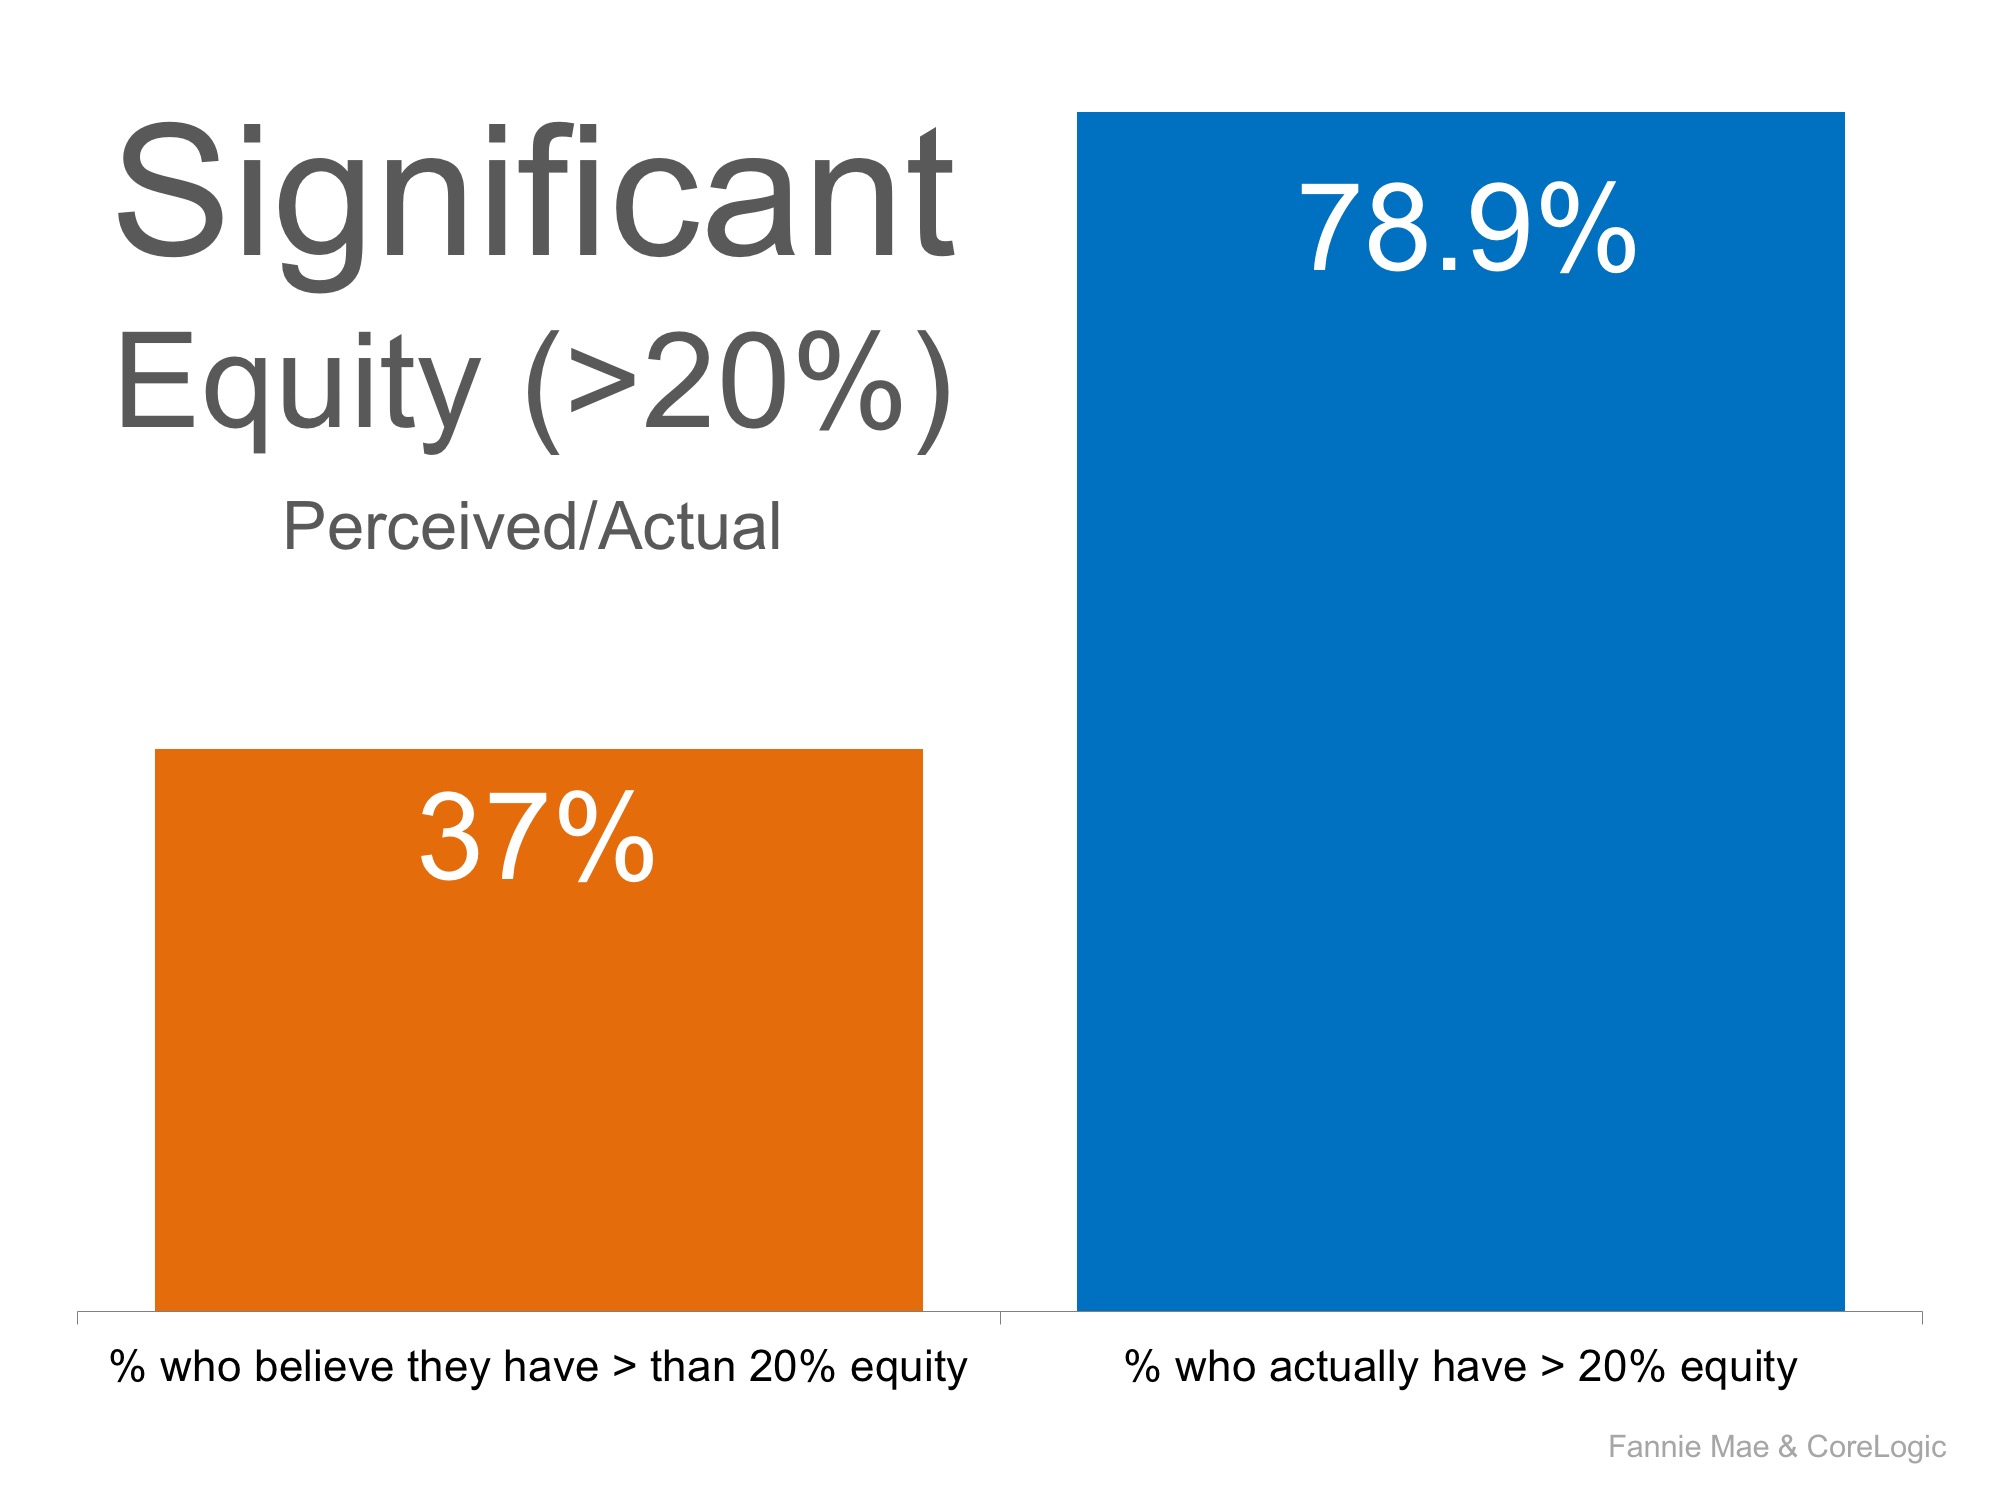
HOME EQUITY
Many homeowners underestimate the amount of equity they currently have in their homes. According to a recent Fannie Mae study, 37% of homeowners believe that they have more than 20% equity in their homes. In reality, CoreLogic’s latest Equity Report tells us that 78.9% actually do!
Many homeowners who are undervaluing the equity they have in their homes may feel trapped, which may be contributing to the lack of inventory in the market.

 Facebook
 X
X
 Pinterest
 Copy Link


 2017 also marked the second year of our #tacklehomelessness campaign with the Seattle Seahawks, in which Windermere committed to donating $100 for every Seahawks home game defensive tackle to


 Given tight supply levels, it is unsurprising to see very solid price growth across the Western Washington counties. Year-over-year, average prices rose 12.3% to $474,184. This is 0.9% higher than seen in the second quarter of this year.

 This speedometer reflects the state of the region’s housing market using housing inventory, price gains, home sales, interest rates, and larger economic factors. For the third quarter of 2017, I have left the needle at the same point as the second quarter. Though price growth remains robust, sales activity has slowed very slightly and listings jumped relative to the second quarter. That said, the market is very strong and buyers will continue to find significant competition for accurately priced and well-located homes.
 Matthew Gardner is the Chief Economist for Windermere Real Estate, specializing in residential market analysis, commercial/industrial market analysis, financial analysis, and land use and regional economics. He is the former Principal of Gardner Economics, and has more than 30 years of professional experience both in the U.S. and U.K.