
 Facebook
 X
X
 Pinterest
 Copy Link
Greater Seattle Area Real Estate Market – 3rd Quarter 2017
The Gardner Report – Third Quarter 2017

ECONOMIC OVERVIEW
The Washington State economy added 79,600 new jobs over the past 12 months—an impressive growth rate of 2.4%, and well above the national growth rate of 1.2%. However, as we anticipated in last quarter’s report, we continue to see a modest slowdown in the growth rate as the state grows closer to full employment. Growth has been broad-based, with expansion in all major job sectors other than Aerospace (a function of a slowdown at Boeing). Given the current rate of expansion, I am raising my employment forecast and now predict that Washington will add 81,000 new jobs in 2017.
Given the robust job market, it is unsurprising that the state unemployment rate continues to fall. The current unemployment rate in Washington State is 4.6% and we are essentially at full employment. Additionally, all counties contained within this report reported either a drop or stability in their unemployment rate from a year ago. I maintain my belief that the Washington State economy will continue to outperform the U.S. as a whole. Given such a strong expansion, we should also expect solid income growth across Western Washington.
HOME SALES ACTIVITY
- There were 25,312 home sales during the third quarter of 2017. This is an increase of 3.6% over the same period in 2016.
- Clallam County maintains its number one position for sales growth over the past 12 months. Only four other counties saw double-digit gains in sales. This demonstrates continuing issues with the low supply of listings. There were modest declines in sales activity in six counties.
- The market remains remarkably tight with listing inventory down by 14.2% when compared to the third quarter of 2016. But inventory is up a significant 32% compared to the second quarter of this year. Pending sales rose by 5.2% over the same quarter a year ago, which suggests that closings in Q4 will still be robust.
- The key takeaway from this data is that inventory is still very low, and the situation is unlikely to improve through the balance of the year.

HOME PRICES
 Given tight supply levels, it is unsurprising to see very solid price growth across the Western Washington counties. Year-over-year, average prices rose 12.3% to $474,184. This is 0.9% higher than seen in the second quarter of this year.
- With demand far exceeding supply, price growth in Western Washington continues to trend well above the longterm average. As I do not expect to see the new home market expand at any significant pace, there will be continued pressure on the resale market, which will cause home prices to continue to rise at above-average rates.
- When compared to the same period a year ago, price growth was most pronounced in Grays Harbor County where sale prices were 20.1% higher than the third quarter of 2016. Nine additional counties experienced double-digit price growth.
- Mortgage rates in the quarter continue to test the lows of 2017, and this is unlikely to change in the near-term. This will allow home prices to escalate further but I expect we will see rates start to rise fairly modestly in 2018, which could slow price growth.
 Given tight supply levels, it is unsurprising to see very solid price growth across the Western Washington counties. Year-over-year, average prices rose 12.3% to $474,184. This is 0.9% higher than seen in the second quarter of this year.

DAYS ON MARKET
- The average number of days it took to sell a home in the quarter dropped by eight days when compared to the same quarter of 2016.
- King County continues to be the tightest market, with homes taking an average of 17 days to sell. Every county except San Juan saw the days on market drop from the same period a year ago.
- This quarter, it took an average of 43 days to sell a home. This is down from the 51 days it took in the second quarter of 2016 and down by 8 days from the second quarter of this year.
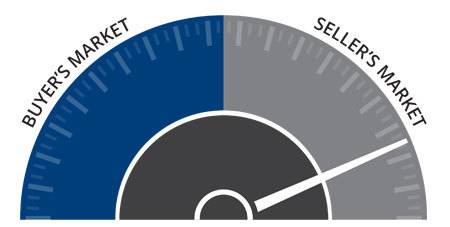
- At some point, inventory will start to grow and this will lead to an increase in the average time it takes to sell a house. However, I do not expect that to happen at any time soon. So we remain in a seller’s market.

CONCLUSIONS
 This speedometer reflects the state of the region’s housing market using housing inventory, price gains, home sales, interest rates, and larger economic factors. For the third quarter of 2017, I have left the needle at the same point as the second quarter. Though price growth remains robust, sales activity has slowed very slightly and listings jumped relative to the second quarter. That said, the market is very strong and buyers will continue to find significant competition for accurately priced and well-located homes.
ABOUT MATTHEW GARDNER
 Matthew Gardner is the Chief Economist for Windermere Real Estate, specializing in residential market analysis, commercial/industrial market analysis, financial analysis, and land use and regional economics. He is the former Principal of Gardner Economics, and has more than 30 years of professional experience both in the U.S. and U.K.
King & Snohomish County Market Stats – August 2017
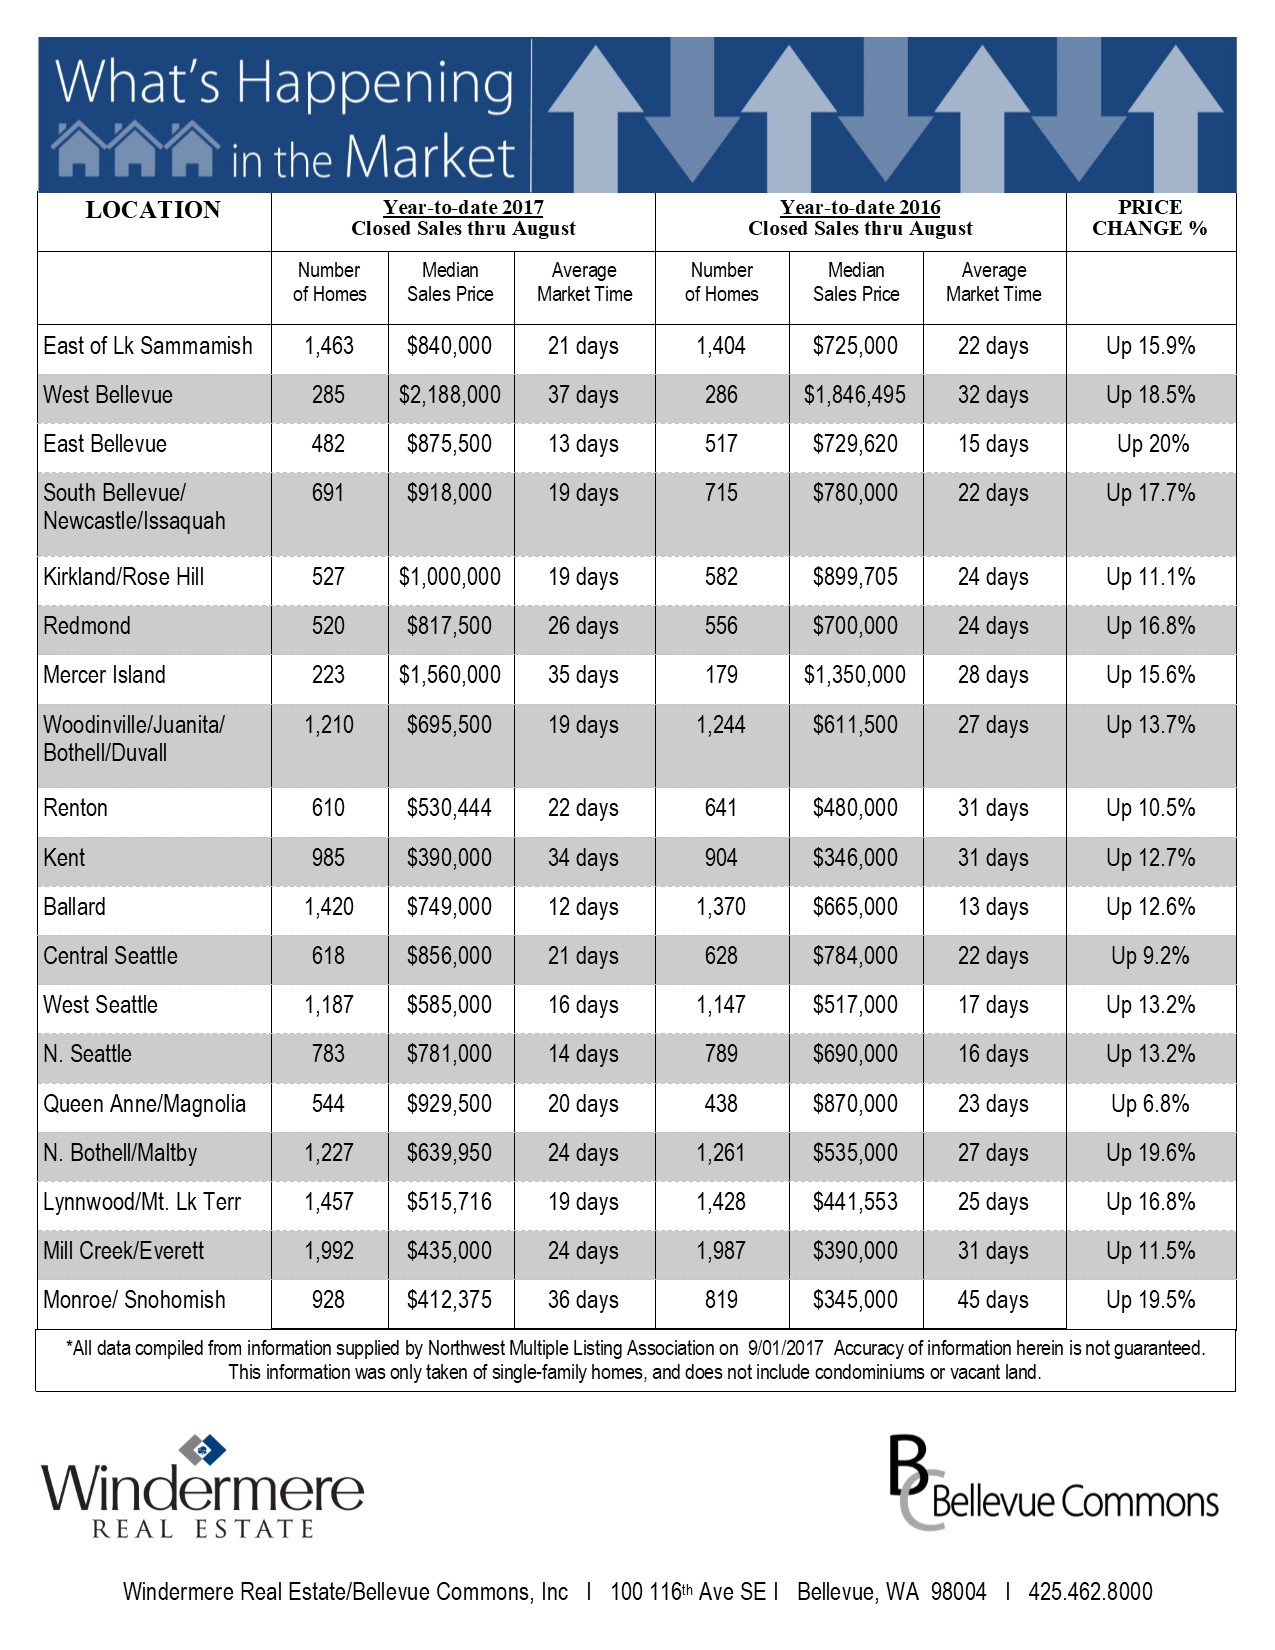
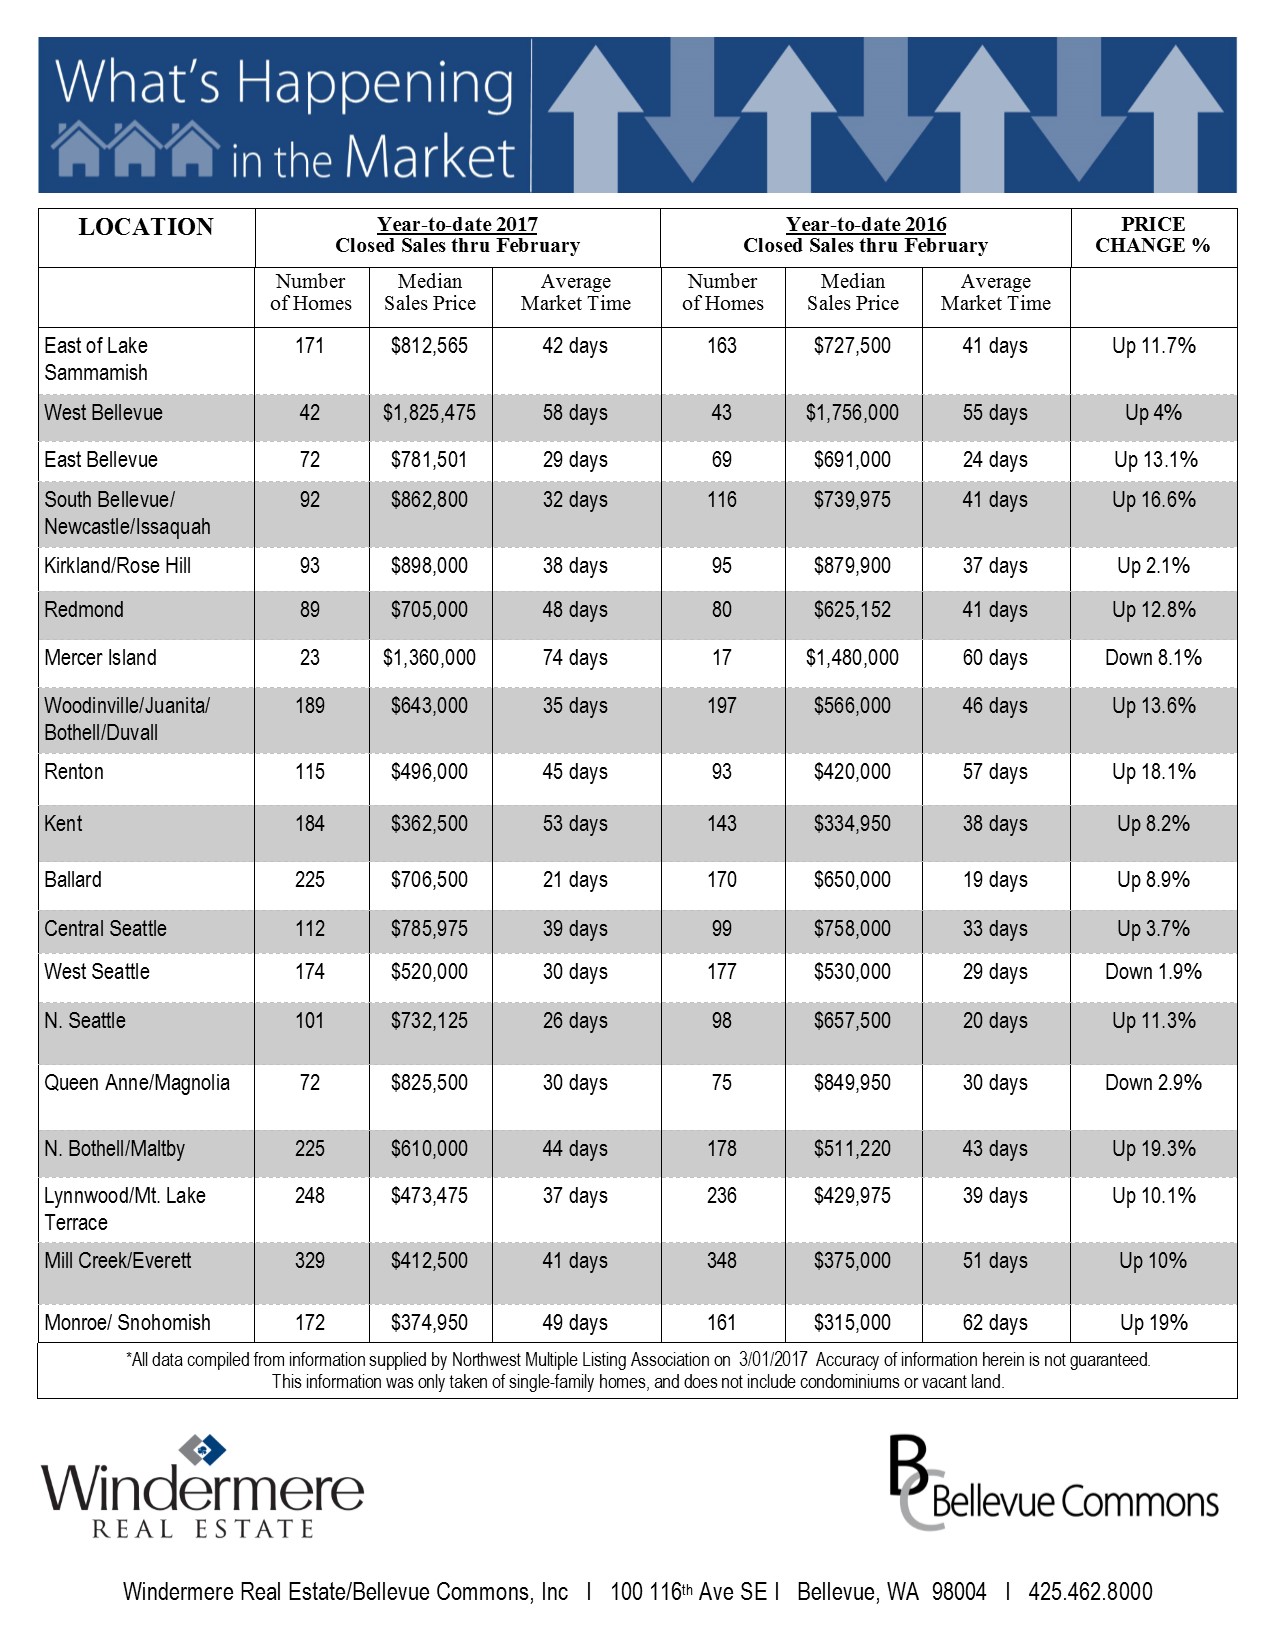
What’s Happening in the Market
Eastside (based on Residential Homes):
Low Inventory
The Real Estate market in August 2017 showed signs of slowing down, but it was interesting to see as home inventory fell, homes under $1.5M on the eastside were still selling at a fast pace while the upper end Buyers were being much pickier.
Less Sail-Fails
Another interesting thing to note was that Sale fails were continuing to drop which is a credit to more qualified Buyers and tighter contracts that are required when competing in a multiple offer situations. It also was because of the pre-inspections being done before writing offers instead of requiring Buyers to find deficiencies and then renegotiate the terms of the contract.

The Gardner Report – 2nd Quarter 2017

|
|||||||||||||||||||
|
|||||||||||||||||||
|
|||||||||||||||||||
|


King & Snohomish County Market Stats – May 2017
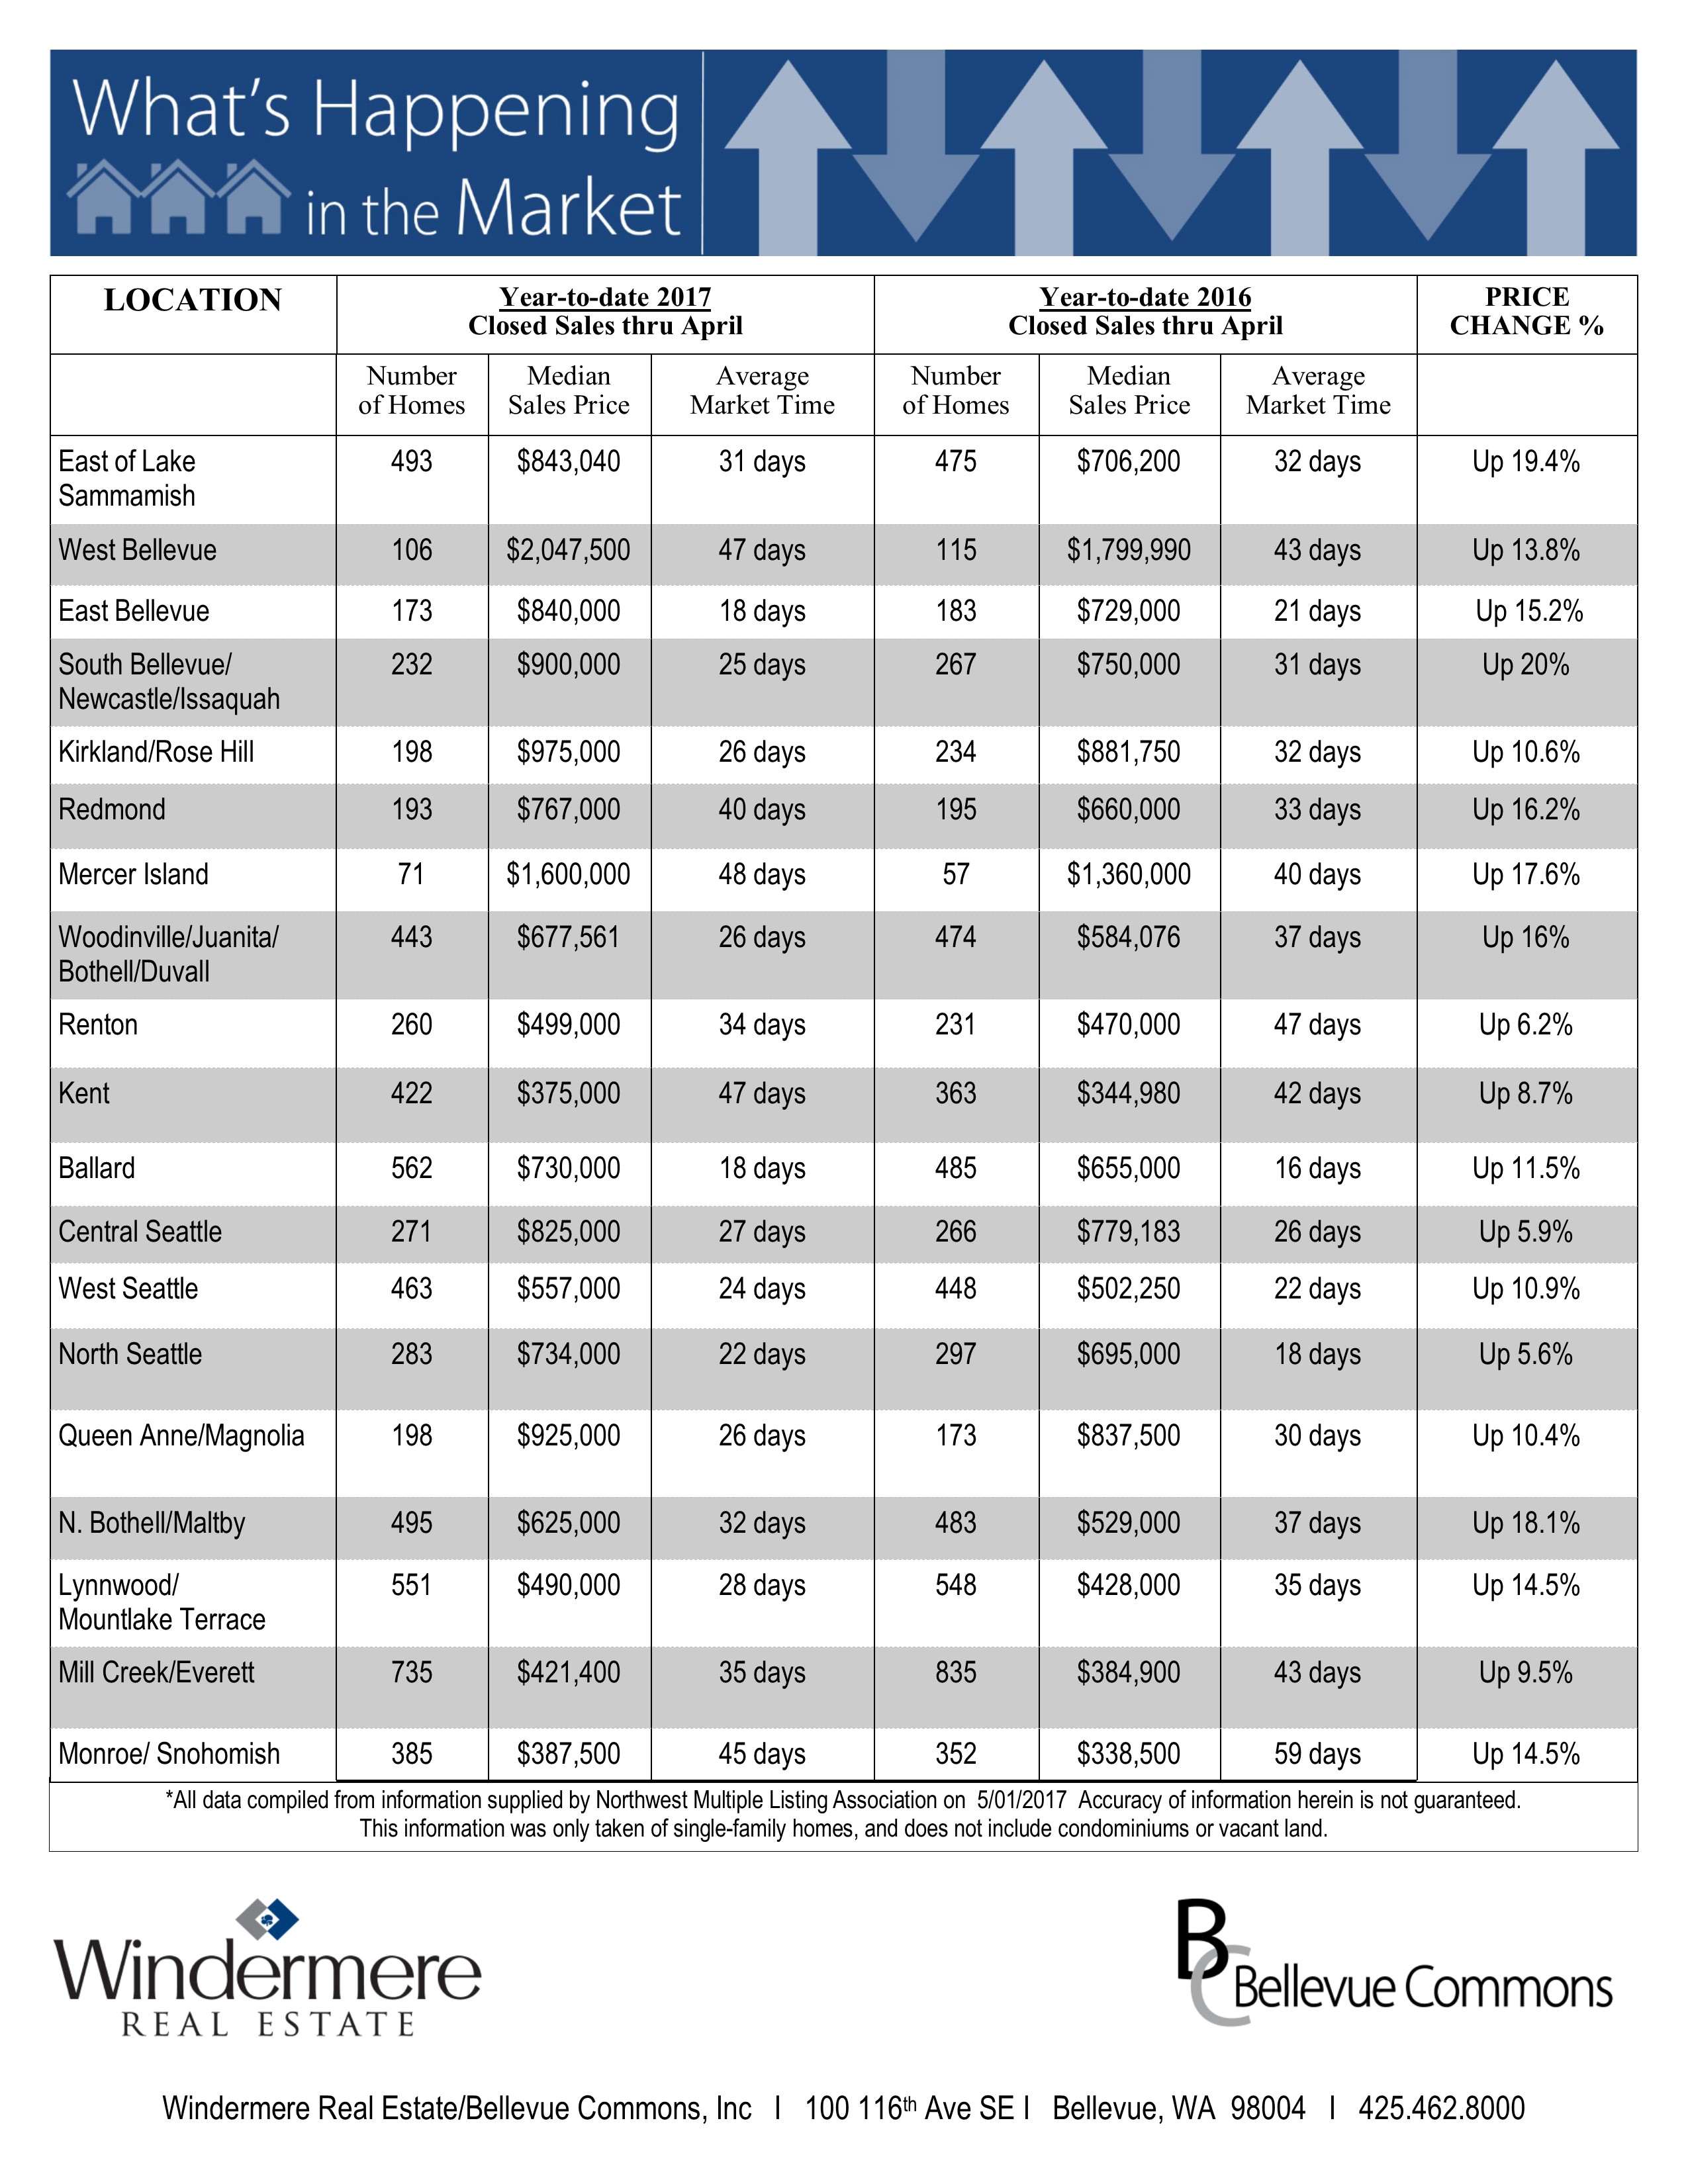
What’s Happening in the Market
Eastside (based on Residential and Condominium report):
- Closed median price at an all-time high of $748,944, up 20% from a year ago
- Price appreciation is being driven by low supply and high demand. Eastside months’ supply of inventory is less than three weeks, the lowest ever!
- 748 active listings as of 4/30/17. Down 33% from the year before and 48% from two years before.
- Scarcity has buyers paying above list price on 65% of the sales that closed in April.
- What was the cost of waiting on year (April 2016 vs April 2017) to buy? $123,944 in median price. $9,026 per year in payment.

King & Snohomish County Market Stats – March 2017
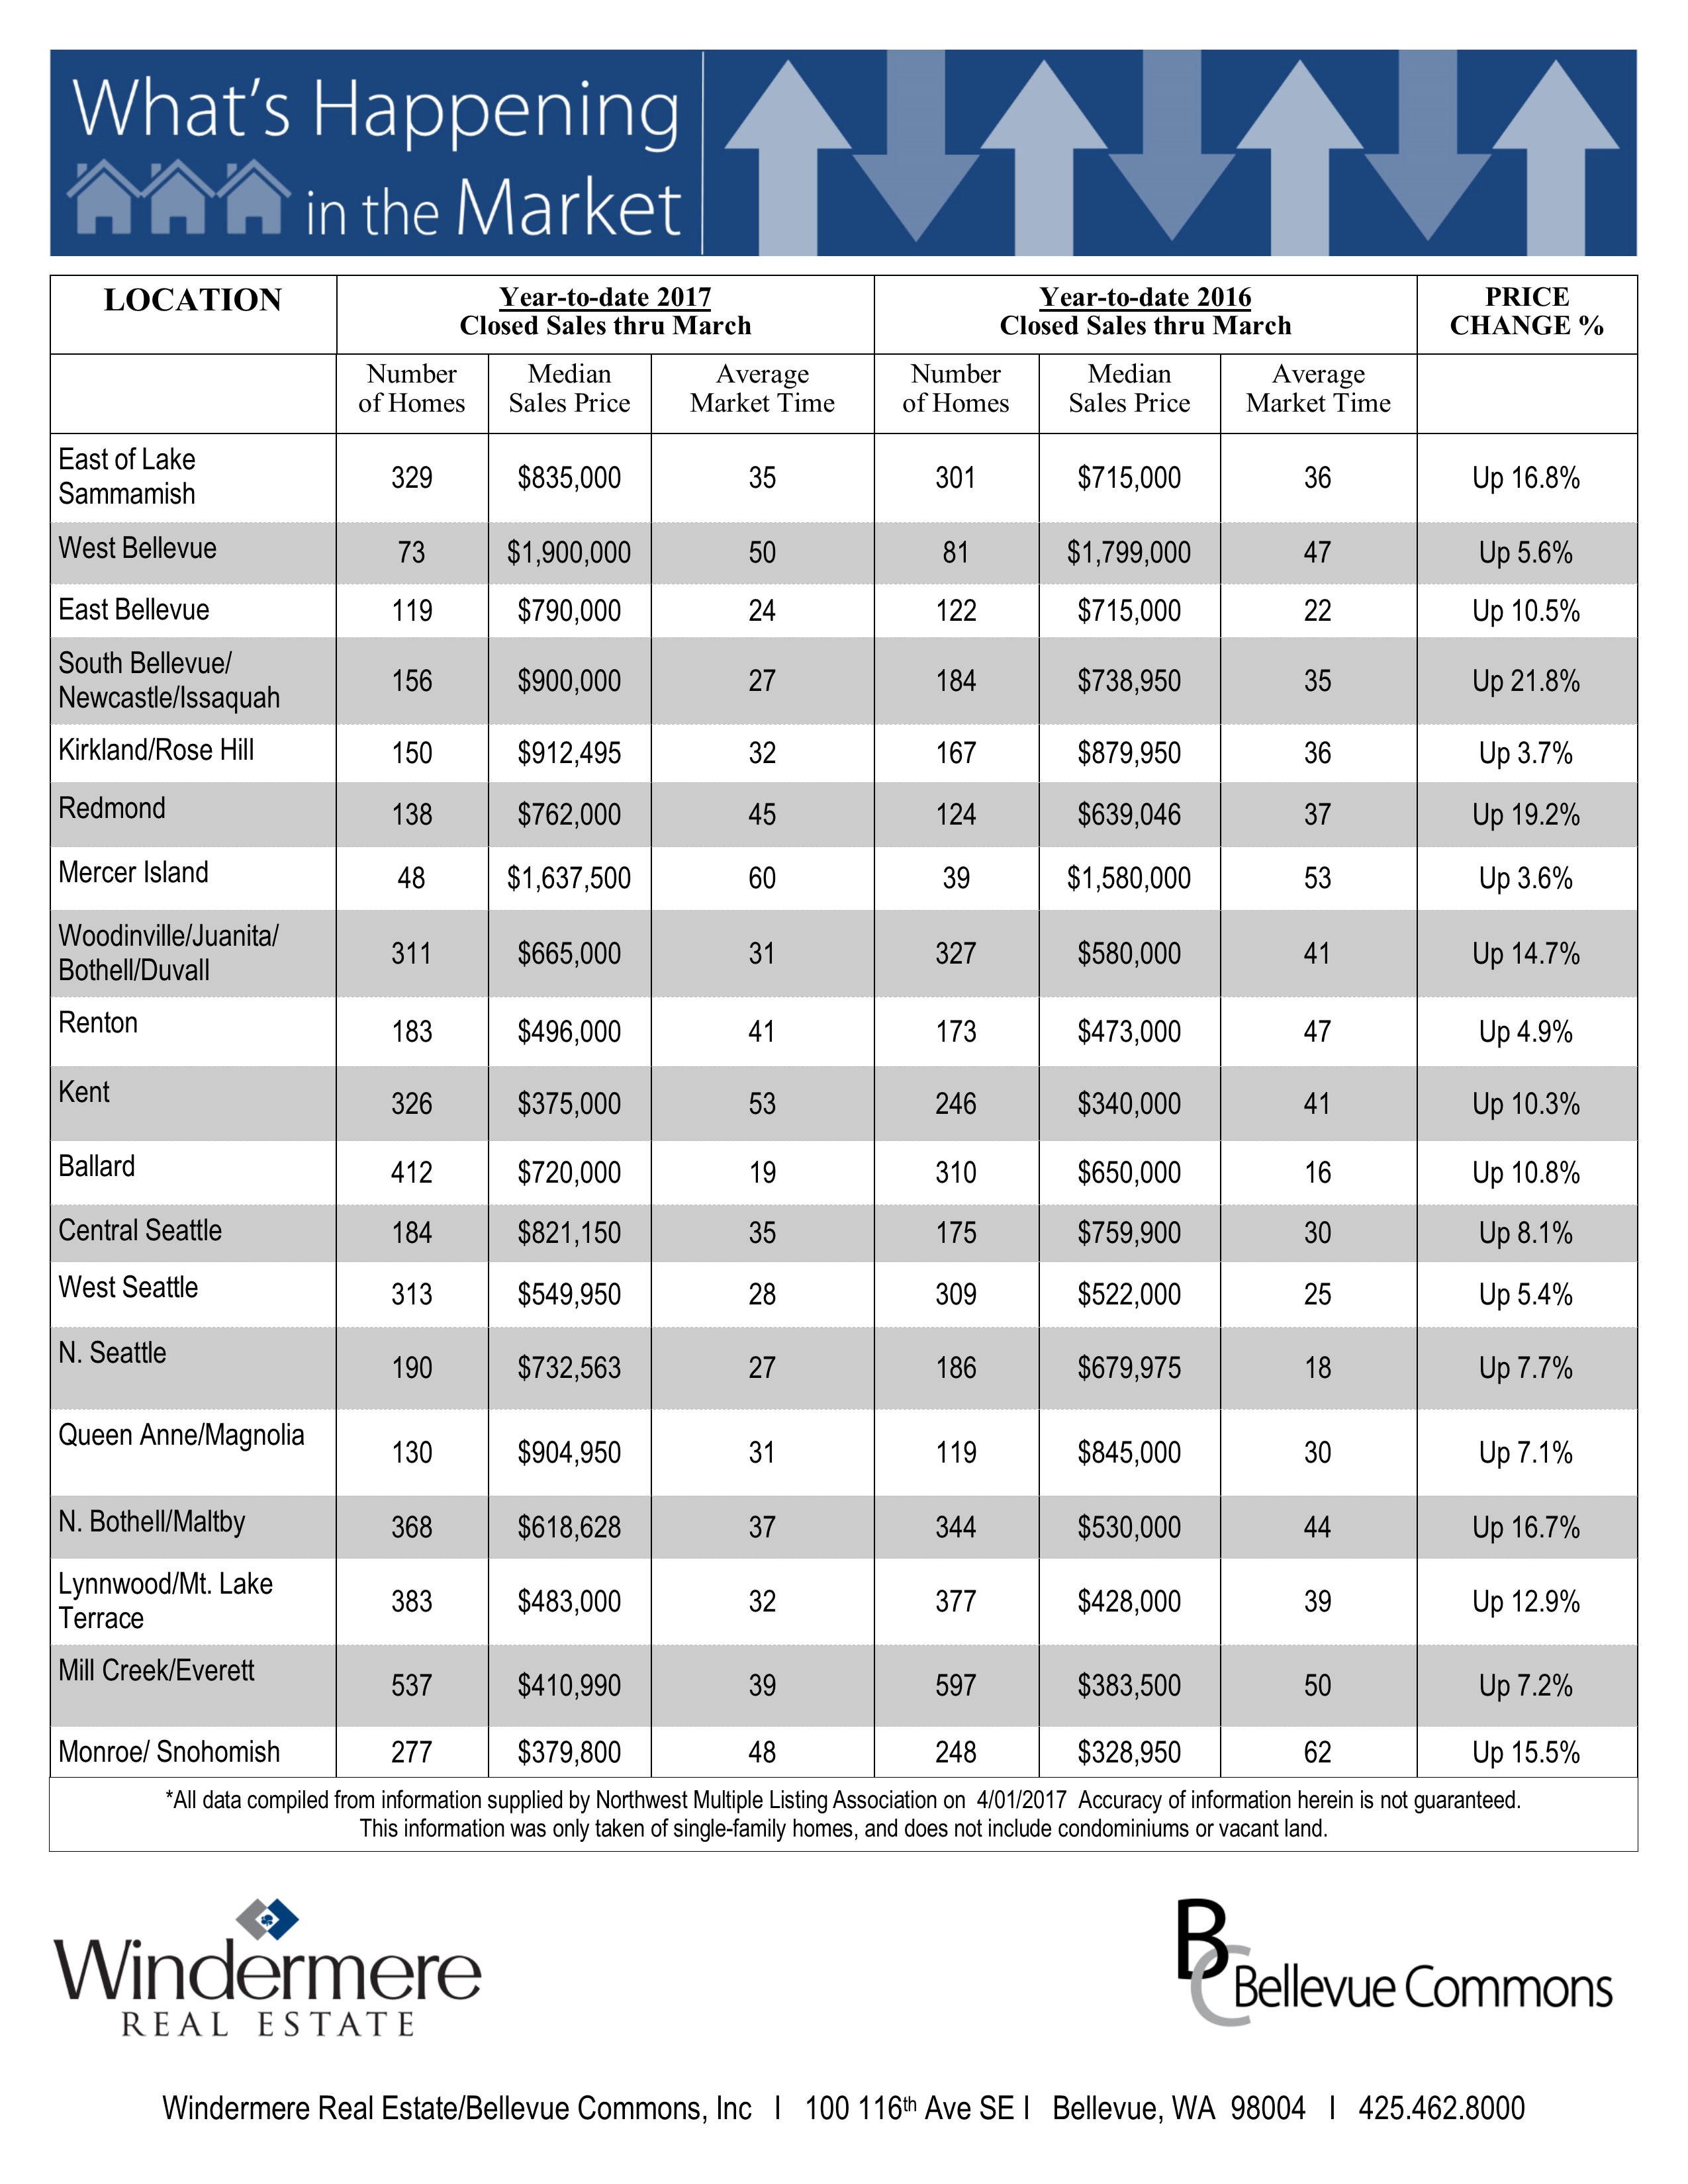
What’s Happening in the Market
- Closed median price at an all-time high of $736,500, up 20% from a year ago.
- Price appreciation is being driven by low supply and high demand. Eastside month’s supply of inventory is less than three weeks (0.7 months), the lowest ever.
- 737 active listings as of 3/31/17. Down 21% from last year and 42% from the year before.
- Scarcity has buyers paying above list price on 61% of the sales that closed in March.
- What was the cost of waiting on year (March 2016 vs March 2017) to buy? $120,400 more in median price. Interest rates up .51%. $769 a month more for the same home.

King & Snohomish County Market Stats – February 2017
What’s Happening in the Market
Home sales continue to be slightly above last year’s totals in the areas tracked in this report. We are continuing to see double digit price increases spread out from the core of Bellevue and Seattle due to the somewhat exorbitant prices now demanded from the metro area Sellers.
Low Inventory
Inventory hit an all-time low in February which at last count was 3 weeks of inventory if nothing new came on the market. (That’s weeks, not months!) We do expect to see an increase in listings in March and April, but Sellers are still wary of putting their home on the market with nowhere to go. Buyers and Buyers agents are having to be creative with their offers as we are seeing at least 50% of the sales occurring are done in multiple offer situations. We don’t expect this to change anytime soon!
How Much Did Residential Home Prices Rise in 2016?
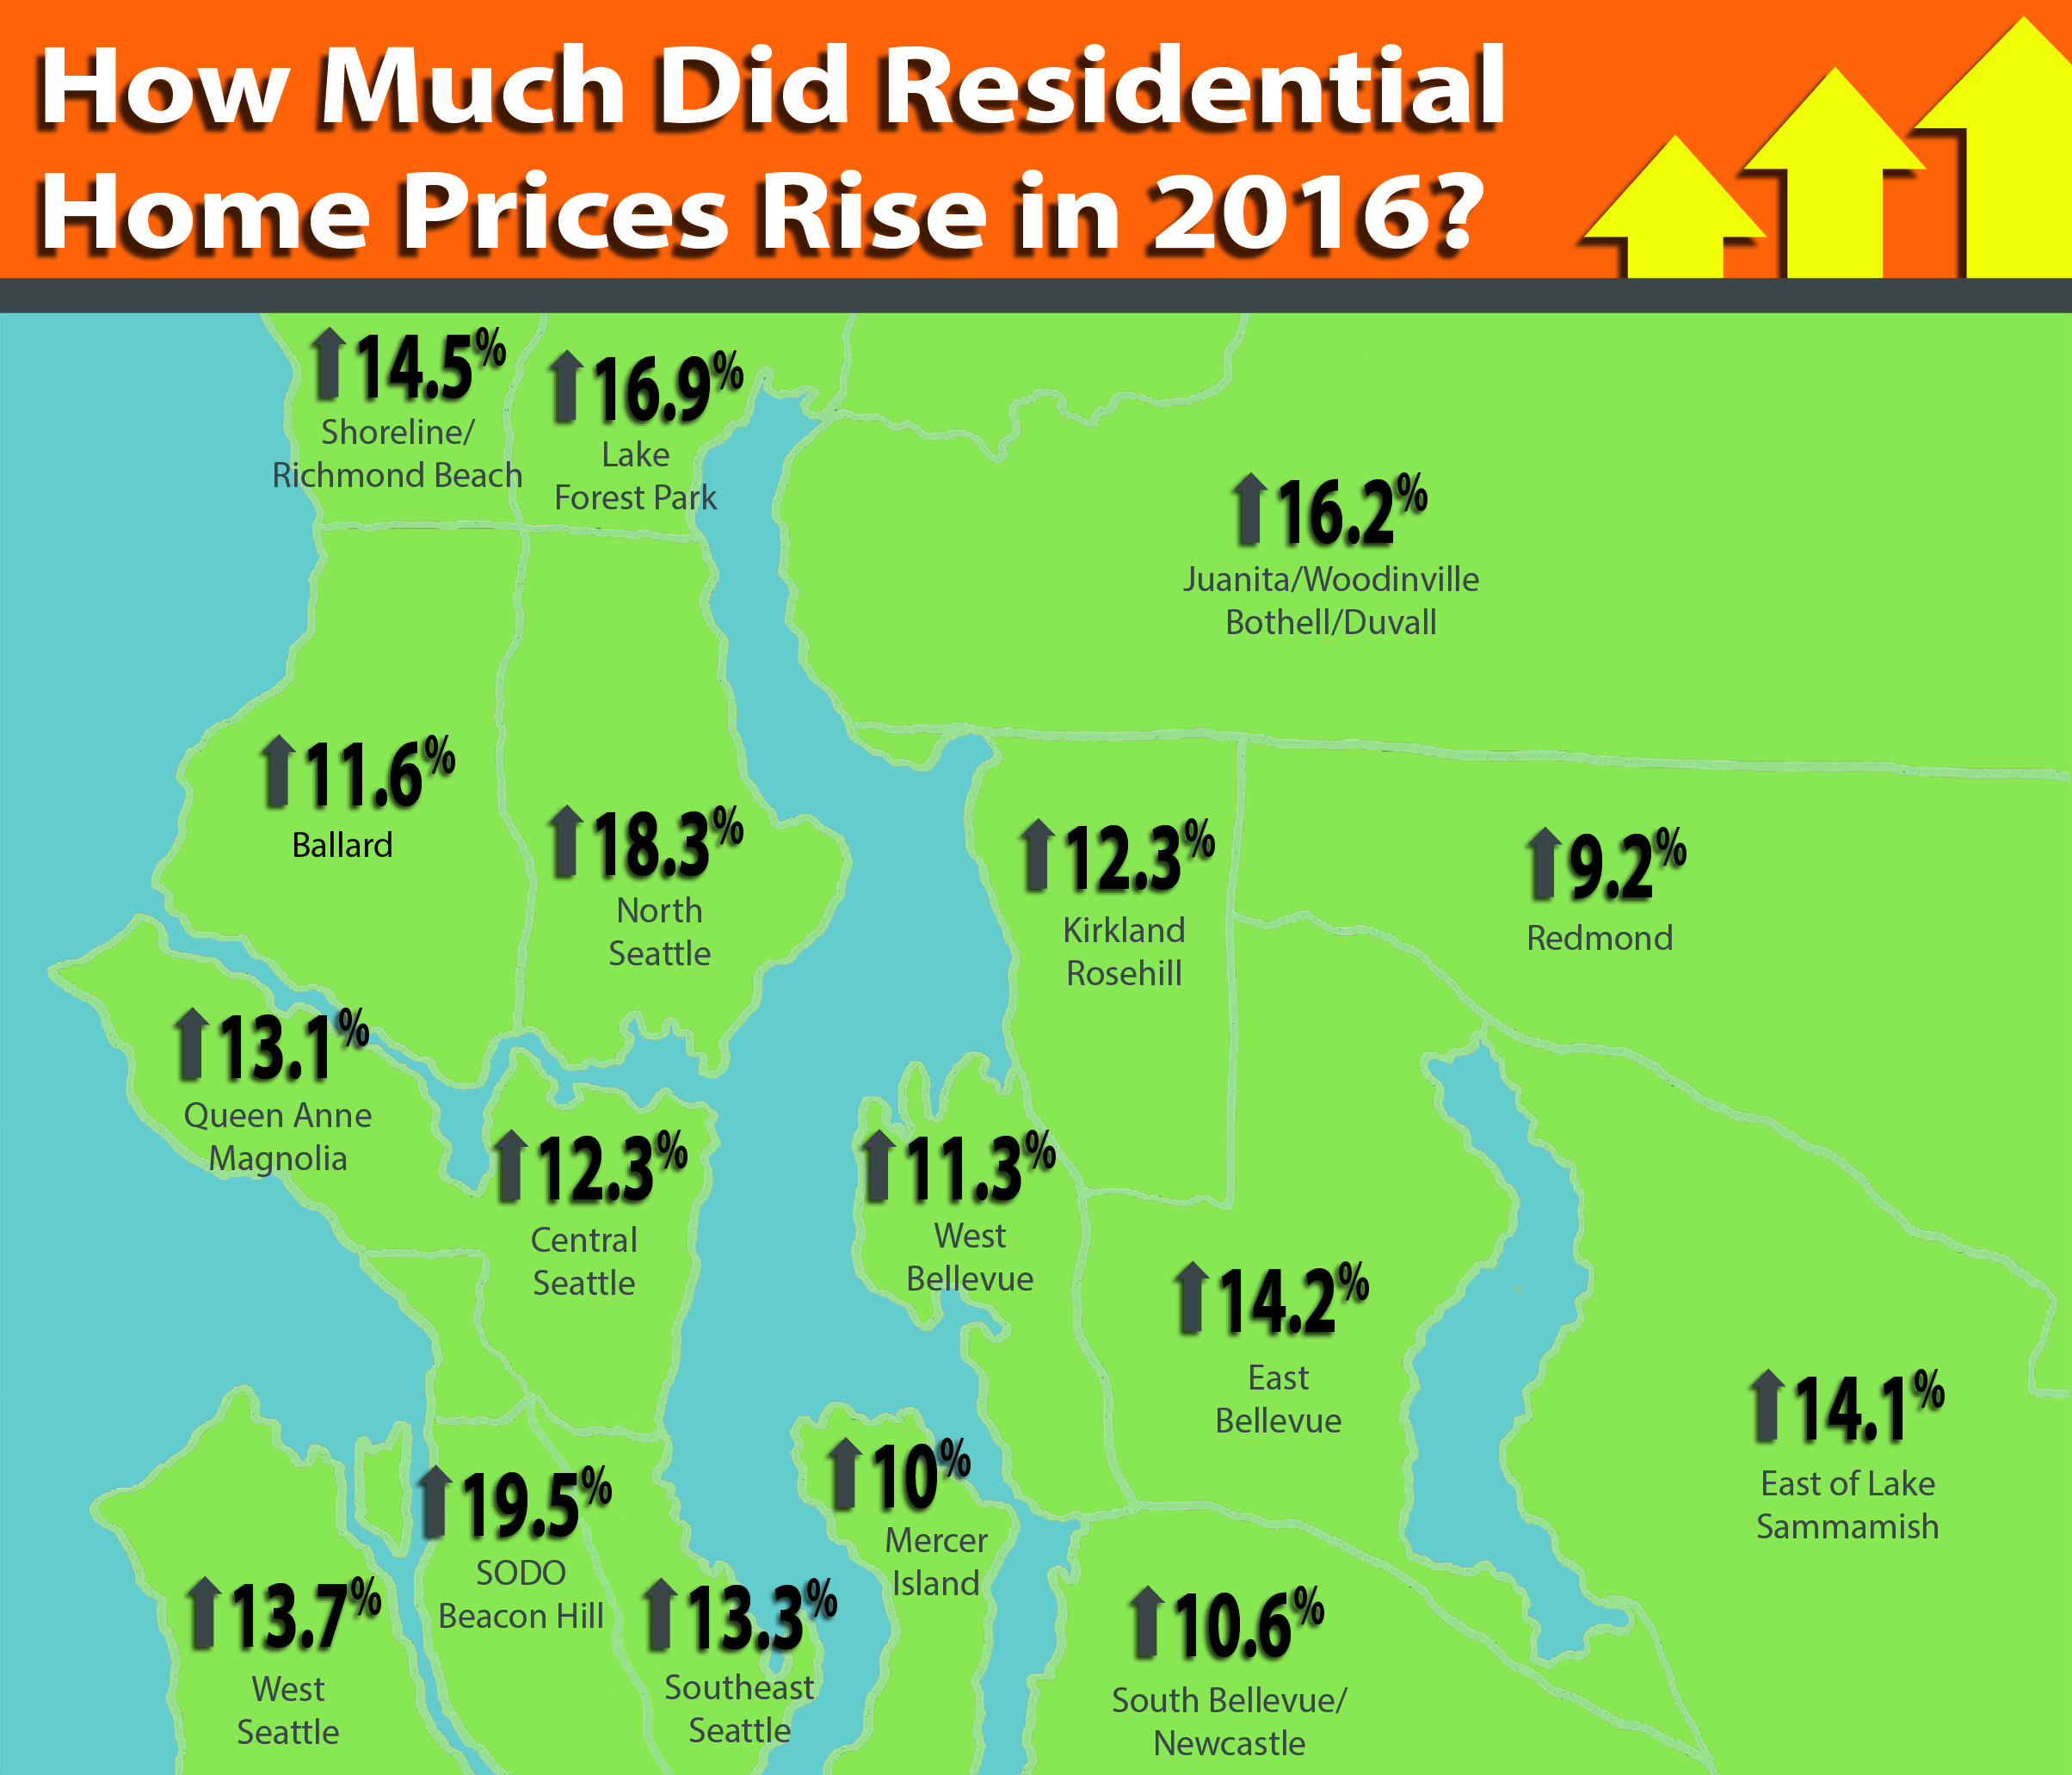
King County Residential Home Price-Increase in 2016
 King County Residential home prices increased an average of 12.7%. Here is the list of median home price-increase in different areas.
| Shoreline/Richmond Beach | $439,725–> $503,393 |
| Lake Forest Park | $432,250–> $505,350 |
| Ballard | $587,000–> $655,000 |
| North Seattle | $575,000–> $679,950 |
| Queen Anne/Magnolia | $780,500–> $882,500 |
| Central Seattle | $689,999–> $774,995 |
| SODO/Beacon Hill | $420,000–> $501,975 |
| West Seattle | $450,000–> $511,500 |
| Southeast Seattle | $441,500–> $500,000 |
| Kirkland/Rosehill | $801,000–> $899,500 |
| Redmond | $650,000–> $709,793 |
| West Bellevue | $1,751,000–> $1,948,000 |
| East Bellevue | $638,950–> $730,000 |
| East Lake Sammamish | $645,000–> $736,001 |
| South Bellevue/Newcastle | $713,000–> $788,888 |
| Mercer Island | $1,195,000–> $1,315,000 |
| Juanita/Woodinville/Bothell/Duvall | $525,000–> $610,000 |
All data compiled from information supplied by Northwest Multiple Listing Association on 1/01/2017 Accuracy of information herein is not guaranteed.
This information was only taken of single-family homes, and does not include condominiums or vacant land.
Western Washington Real Estate Market Update


OVERVIEW of Western Washington Real Estate Market
Here is a detailed overview of Western Washington Real Estate Market. Washington State finished the year on a high with jobs continuing to be added across the market. Additionally, we are seeing decent growth in the area’s smaller markets, which have not benefited from the same robust growth as the larger metropolitan markets.
Unemployment rates throughout the region continue to drop and the levels in the central Puget Sound region suggest that we are at full employment. In the coming year, I anticipate that we will see substantial income growth as companies look to recruit new talent and keep existing employees happy.
HOME SALES ACTIVITY
- There were 19,745 home sales during the fourth quarter of 2016—up by a very impressive 13.4% from the same period in 2015, but 18.7% below the total number of sales seen in the third quarter of the year. (This is a function of seasonality and no cause for concern.)
- Sales in Clallam County grew at the fastest rate over the past 12 months, with home sales up by 47%. There were also impressive sales increases in Grays Harbor and Thurston Counties. Jefferson County had a fairly modest decrease in sales.
- The number of available listings continues to remain well below historic averages. The total number of homes for sale in the fourth quarter was down by 13.7% compared to the same period a year ago.
- The key takeaway from this data is that 2017 will continue to be a seller’s market. We should see some improvement in listing activity, but it is highly likely that demand will exceed supply for another year.

HOME PRICES

- Demand continued to exceed supply in the final three months of 2016 and this caused home prices to continue to rise. In the fourth quarter, average prices rose by 7.1% but were 0.4% higher than the third quarter of the year. The region’s average sales price is now $414,110.
- In most parts of the region, home prices are well above historic highs and continue to trend upward.
- When compared to the fourth quarter of 2015, price growth was most pronounced in Kittitas County. In total, there were eight counties where annual price growth exceeded 10%. We saw a drop in sales prices in the notoriously volatile San Juan County.
- The aggressive home price growth that we’ve experienced in recent years should start to taper in 2017, but prices will continue to increase at rates that are higher than historic averages.

DAYS ON MARKET
- The average number of days it took to sell a home in the fourth quarter dropped by 15 days when compared to the fourth quarter of 2015.
- King County was the only area where it took less than a month to sell a home, but all markets saw decent improvement in the time it took to sell a home when compared to a year ago.
- In the final quarter of the year, it took an average of 64 days to sell a home. This is down from the 78 days it took in the third quarter of 2015, but up from the 52 days it took in the third quarter of 2016. (This is due to seasonality and not a cause for concern.)
- We may experience a modest increase in the time it takes to sell a home in 2017, but only if there is a rapid increase in listings, which is certainly not a given.

CONCLUSIONS
 This speedometer reflects the state of the region’s housing market using housing inventory, price gains, sales velocities, interest rates, and larger economic factors. For the fourth quarter of 2016, I actually moved the needle a little more in favor of buyers, but this is purely a function of the increase in interest rates that was seen after the election. Higher borrowing costs mean that buyers can afford less, which could ultimately put some modest downward pressure on home prices in 2017. That said, the region will still strongly favor sellers in the coming year.
This article were first Posted on windermere.com by Matthew Gardner, Chief Economist, Windermere Real Estate
