
 Facebook
 X
X
 Pinterest
 Copy Link
King & Snohomish County Market Stats – September 2016
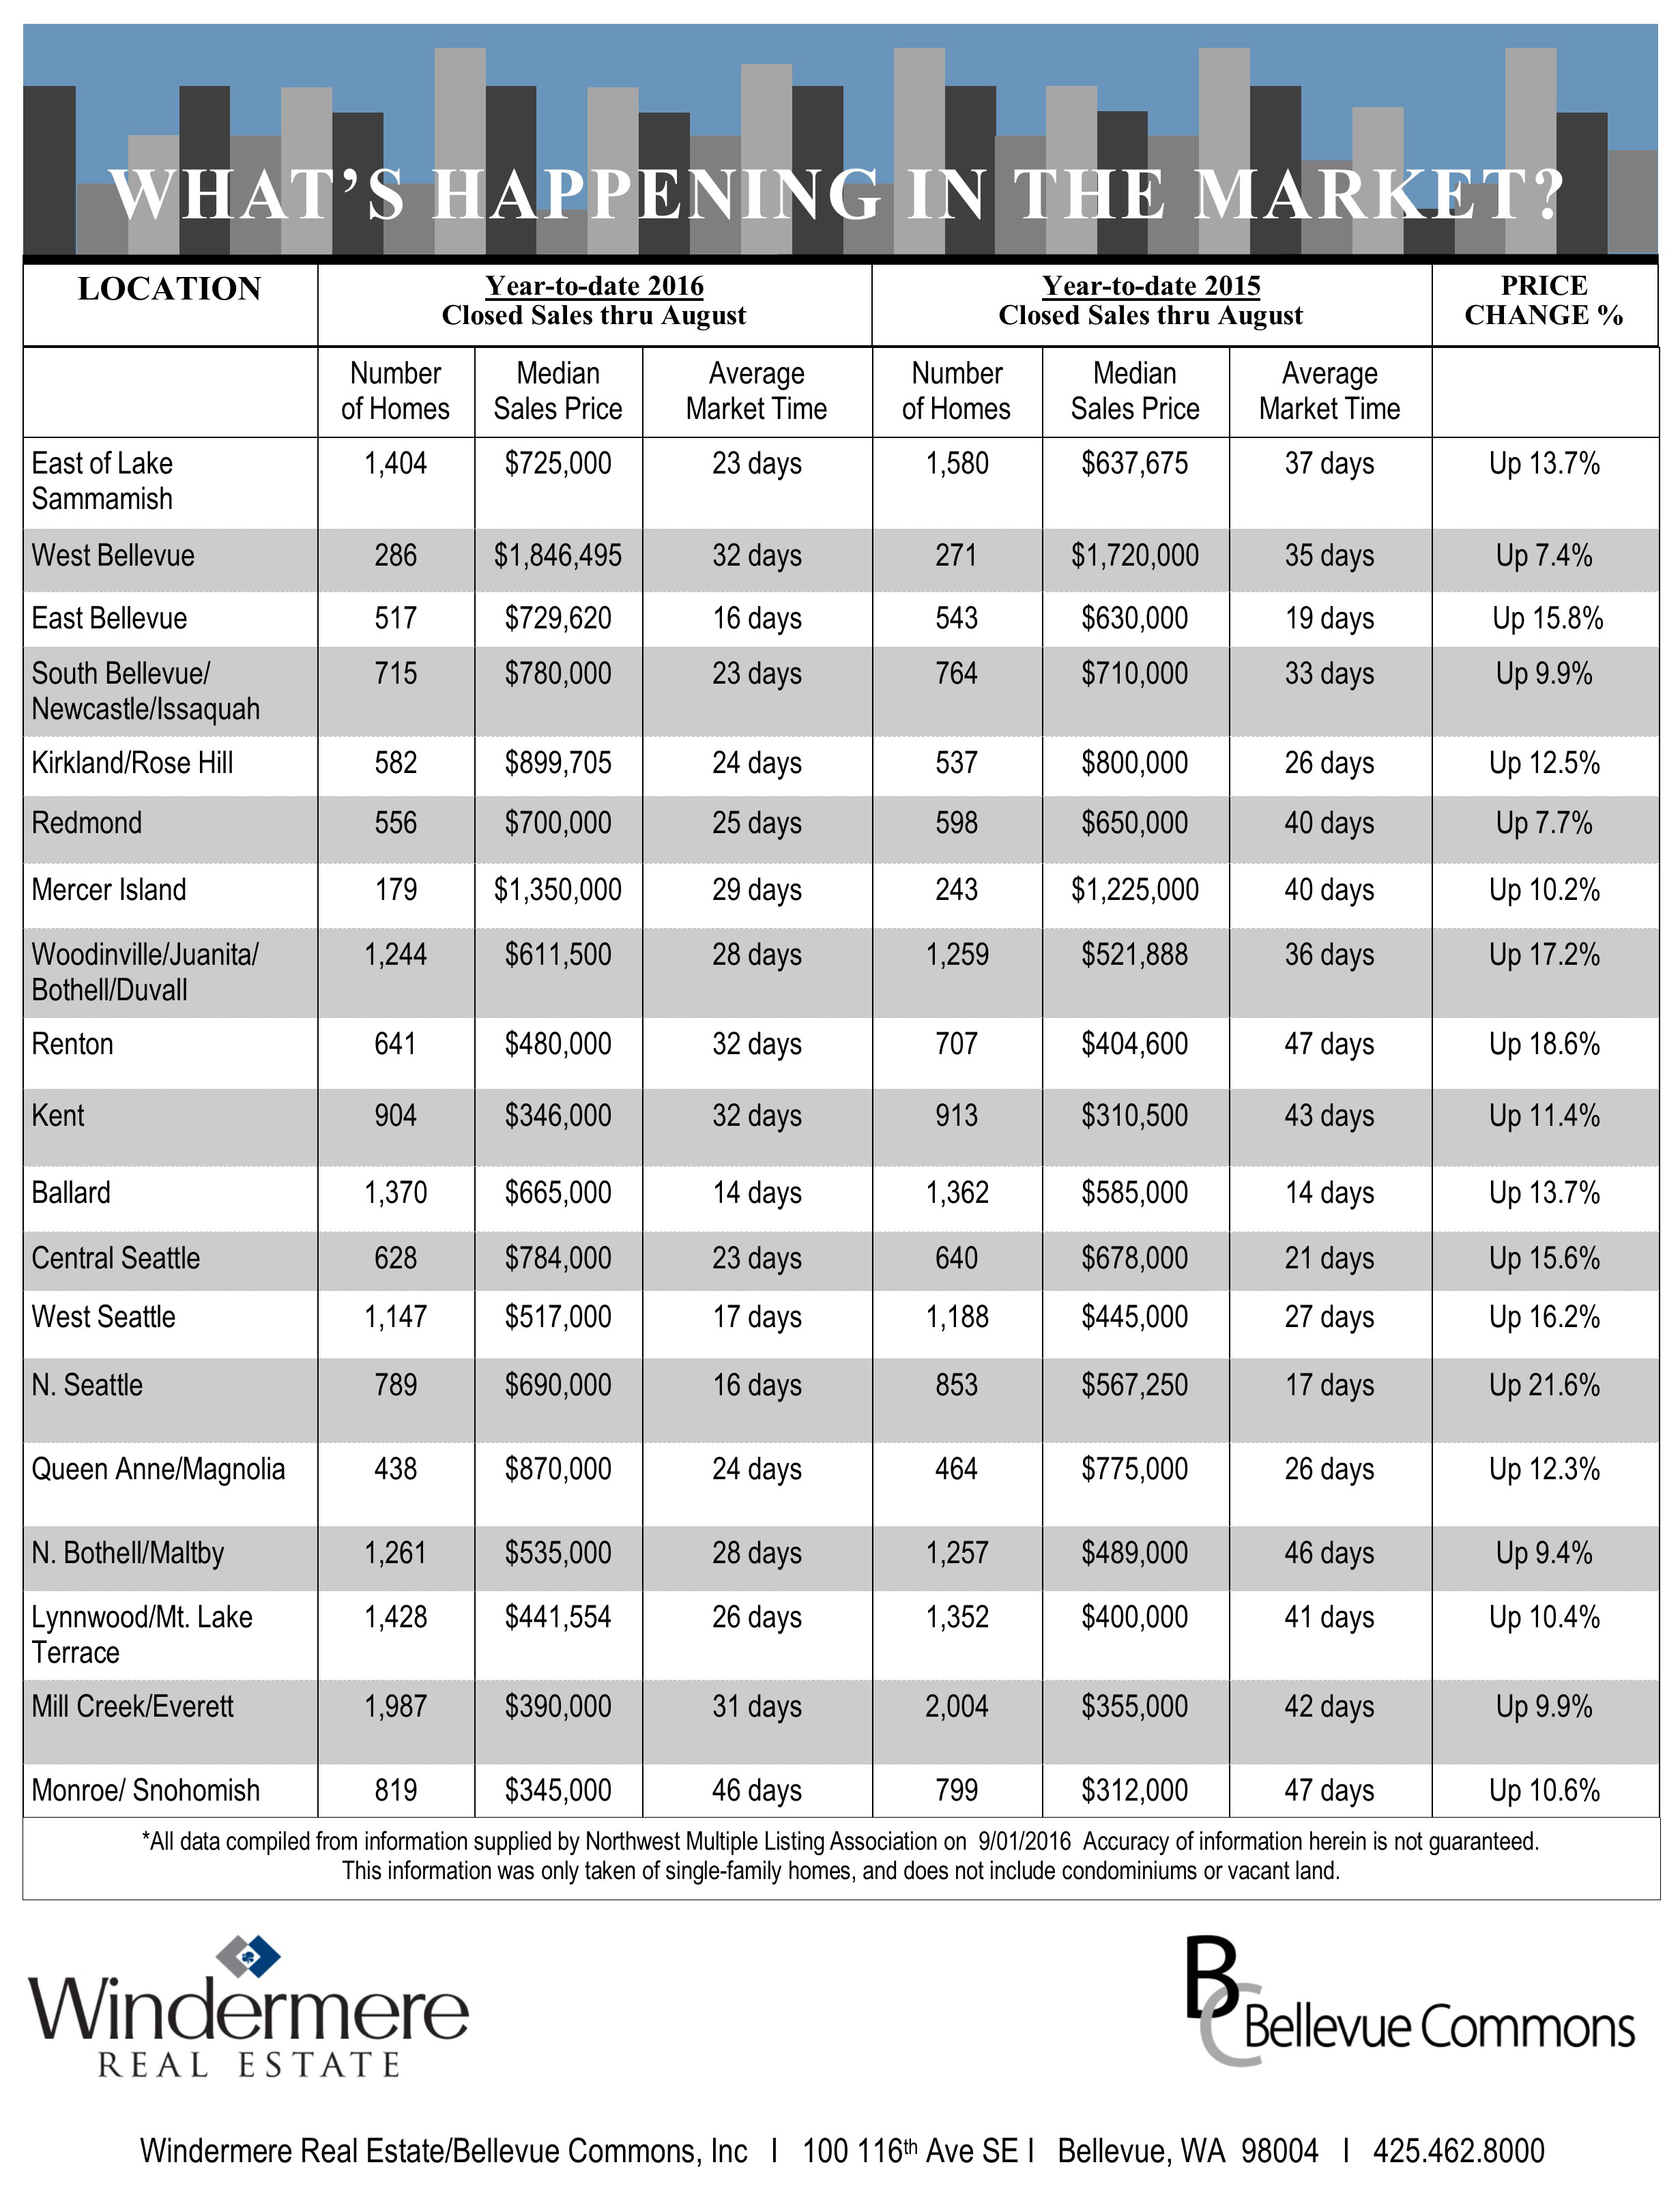
What’s Happening In The Market?
While prices seem to have leveled out over the past 2 months the Days on Market have been still reducing at about a 5% clip per month. Inventory has had slight increases across the marketplace, however, the Pending Sales have been trending upwards which has been eating up any inventory gains. This is not the first time we have seen this type of activity over the past 12-24 months and don’t expect it to change anytime soon.

We’ve got you covered – Windermere Winter Drive
 We’re excited to announce that our office is participating in Windermere’s”We’ve Got You Covered” winter drive benefiting YouthCare.
BUT WE CAN DO MORE!
Each night in Seattle, nearly 1,000 young people are homeless. And with the winter months quickly approaching, YouthCare is in dire need of survival supplies to keep homeless youth warm and dry during the long, wet winter.
- Warm socks
- Hats
- Scarves
- Gloves/mittens
*New items only!
Please bring your donations to our office by November 14, 2016.

Easy Halloween Decorations
Halloween in one of our favorite Holidays. Right at the beginning of Fall we start seeing Halloween decorations in every store. For some it’s easier to buy their decorations and get done with it; for others it’s more fun to decorate their homes on their own.
Here are some great Spooktacular DIY projects to make your perfect haunted home!
1- Trash Bag Spider Webs (Click to see the full description)
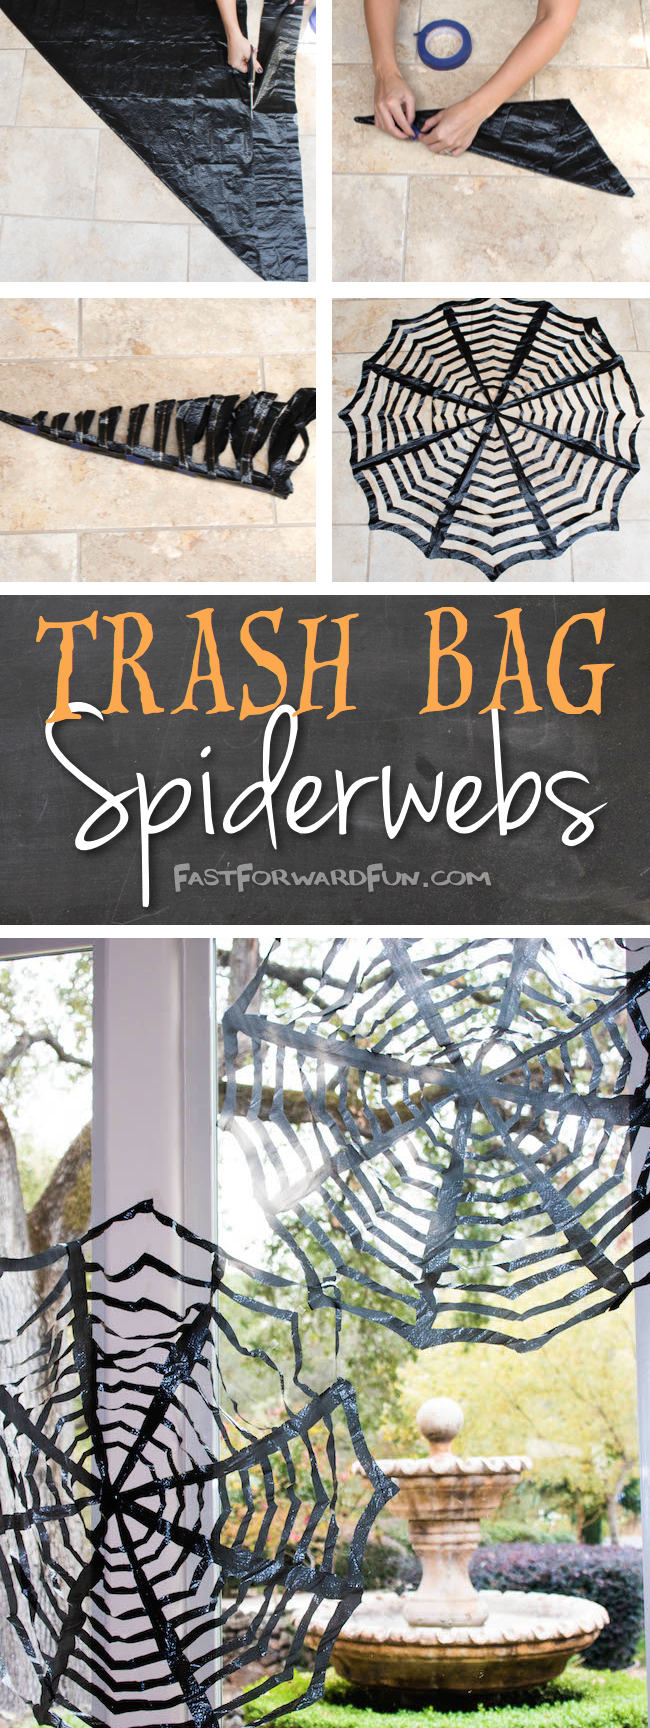
Source: fastforwardfun.com
2- Halloween Door Matt (Click to see the full description)


Source: celebrations.com
3- Skeleton Dish (Click to see the full description)


Source: fourfrontdoors.blogspot.com
4- Spirit Jugs (Click to see the full description)

Source: eighteen25.com
Happy Halloween!
King & Snohomish County Market Stats – August 2016
What’s happening in the Market?
“The sold prices are exceeding 10% year over year in most areas.”
While the Market continues to move at a strong pace, we are roughly 5% behind last year’s Closed Sales pace. This is primarily due to lack of inventory as demand is still high as determined by the continued reduction of days on market. This heightened demand is also indicated in the sold prices exceeding 10% year over year in most areas.
Top Real Estate Books to Read…
On International Literacy Day, we thought we'd share our Top Real Estate Books worth Reading.
Add your favorite RE book in the comments.
1. "The Millionaire Real Estate Agent" by Gary Keller
2. "The Go-Giver: A Little Story About a Powerful Business Idea" by Bob Burg & John David Mann
3. "Endless Referrals" by Bob Burg
4. "The One Minute Sales Person" by Spencer Johnson
5. "The Compound Effect" by Darren Hardy

Who is the REAL “Rosie”?

The World War II-era woman who rolled up her sleeves, flexed her arm muscles and said, "We Can Do It!" isn't the original Rosie.
In 1942, as the song "Rosie the Riveter" filled radio waves across the home front, manufacturing giant Westinghouse commissioned artist J. Howard Miller to make a series of posters to promote the war effort. One such poster featured the image of a woman with her hair wrapped up in a red polka-dot scarf, rolling up her sleeve and flexing her bicep and the words 'We Can Do It!' printed at the top.
The original "Rosie" image popular during the war was created by illustrator Norman Rockwell for the cover of the Saturday Evening Post on May 29, 1943. The image depicts a muscular woman wearing overalls, goggles and pins of honor on her lapel. She sports a leather wrist band and rolled-up sleeves. She sits with a riveting tool in her lap, eating a sandwich, and "Rosie" is inscribed on her lunch pail. And, she's stepping on a copy of Adolph Hitler's book "Mein Kampf."
"Manufacturing giant Westinghouse
commissioned artist J. Howard Miller
to make a series of posters to promote the war effort."
Rosie the Riveter 
Norman Rockwell 1943
Source: rockwell-center.org
After the war, numerous requests were made for the Saturday Evening Post image of Rosie the Riveter, but Curtis Publishing, the owner of the Post, refused all requests. The publishing company was possibly concerned that the composers of the song "Rosie the Riveter" would hold them liable for copyright infringement.
Since then, the J. Howard Miller "We Can Do It!" image has replaced Norman Rockwell's illustration as "Rosie the Riveter" in the minds of many people. Miller's Rosie has been imprinted on coffee mugs, mouse pads, and countless other items, making her and not the original "Rosie" the most famous of all labor icons.
Just a little "Did You Know?" to honor our American Workforce as we celebrate Labor Day.
This article was first published in: Dol.gov

Seattle Seahawks and Windermere Real Estate Announce New Partnership
To say that Windermere has a lot of Seahawks fans would be an understatement. That’s why we are so excited to announce today that we are now the “Official Real Estate Company of the Seattle Seahawks”!
At the center of this partnership with the Seahawks is a new #tacklehomelessness campaign in which the Windermere Foundation will donate $100 for every Seahawks tackle at home during the 2016 season. On the receiving end of these donations is YouthCare, a Seattle-based non-profit organization that has been providing services and support to homeless youth from across Puget Sound for more than 40 years. Since 1989, the Windermere Foundation has donated over $30 million to non-profits that support low-income and homeless families, so partnering with YouthCare and the Seahawks on the#tacklehomelessness campaign is a perfect fit for us.
“We are proud to partner with Windermere, an iconic and locally-based company with a deep commitment to this community,” said Seahawks Vice President of Corporate Partnerships Amy Sprangers. “Windermere’s brand and values align perfectly with our commitment to this region. It is wonderful that this partnership will make a positive impact on homeless youth throughout the Seattle area.”
If you’re not already excited about the upcoming Seahawks season, this video should do it.
Now say it with us . . . Go Hawks!
Source: www.windermere.com/blogs
Real Estate Economics – 2016 2nd Q Gardner Report
Western Washington Real Estate Market Update
Washington State continues to see strong employment growth, outpacing national numbers with an annual rate of more than 3%. Interestingly enough, despite these substantial job gains, the unemployment rate remains stubbornly high at 5.8%.

ECONOMIC OVERVIEW
Washington State continues to see strong employment growth, outpacing national numbers with an annual rate of more than 3%. Interestingly enough, despite these substantial job gains, the unemployment rate remains stubbornly high at 5.8%. However, I’m not overly concerned about this because it’s largely due to a growing labor force rather than a declining job market. This means that those who are unemployed who had previously stopped looking for work are now resurrecting their job searches because they have confidence in the economy.
I expect to see a modest drop in the unemployment rate through the balance of the year, and believe we will continue to outperform the nation as a whole with above-average job gains.
HOME SALES ACTIVITY
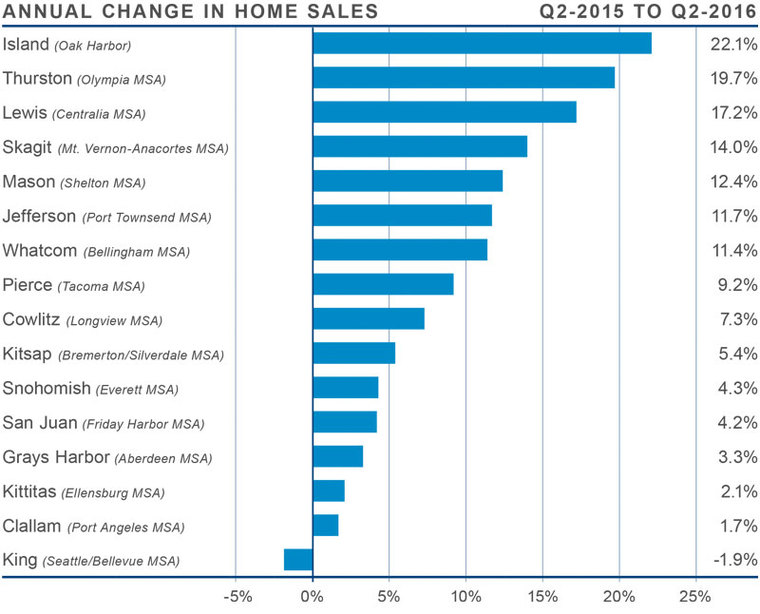
- There were 22,721 home sales during the second quarter of 2016, up by 4.4% from the same period in 2015. We finally saw a much-needed increase in listings, which rose by 30.1% between first and second quarter. This increase in the number of homes for sale led to an increase in sales, which rose by 4.4% when compared to the same period in 2015.
- Island County saw sales grow at the fastest rate over the past 12 months, with sales up by 22.1%. This is a small county which is subject to wild swings, so I take the data at face value. That said, the larger Thurston County saw sales up by an equally impressive 19.7%. Most interesting is that King County saw sales fall modestly compared to the same time period in 2015. Price—and supply—are clearly an issue in the most populous county in our state.
- Overall listing activity was down by 21.8% compared to the second quarter of 2015, but the good news is that the supply side deficit is actually getting a little less than we have seen over the past few years. The total number of homes for sale was 30.1% higher than seen at the end of the first quarter. While much of this can be attributed to seasonality, it is still nice to see!
- The region is experiencing positive job growth, and with it, migration to Washington State is running at a very brisk pace. Given these factors—in addition to our lack of new home construction—it is not surprising to see demand substantially usurping supply. As I look forward, I believe inventory levels will continue to rise modestly, but it will remain a solidly seller's market for the rest of the year.
HOME PRICES
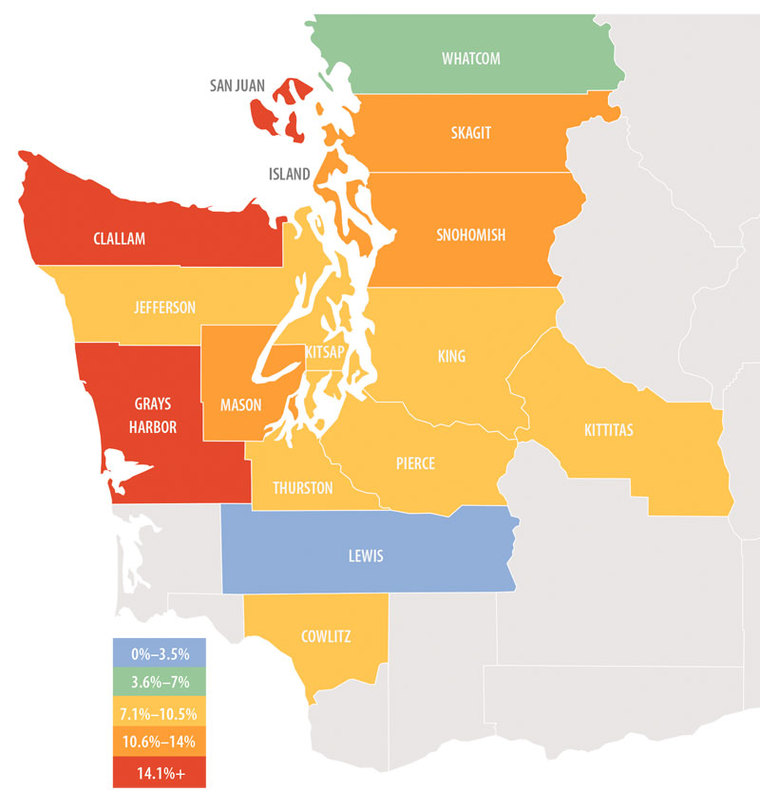
- With demand still exceeding supply, we should not be surprised to see average sale prices continuing to rise, as is certainly the case in our region. Home prices rose by 8.1% between the second quarter of 2015 and the second quarter of this year. This is down from the annual rate of 10.1% that we showed in our last report, but the rate is still far higher than the historic average of 4%.
- Regular readers of this report will remember that there were several counties where average sale prices in the first quarter were actually lower than seen a year before. I suggested that seasonality was to blame and that was indeed the case, with all counties in this report now showing annualized price gains.
- When compared to the second quarter of 2015, price growth was most pronounced in San Juan County and, in total, there were nine counties where annual price growth exceeded 10%.
- The prevailing supply/demand imbalance continues to push prices higher, and persistently low interest rates are just adding fuel to the flames. If rates stay at current levels, it is unlikely that we will see much in the way of slowing appreciation for the rest of the year.
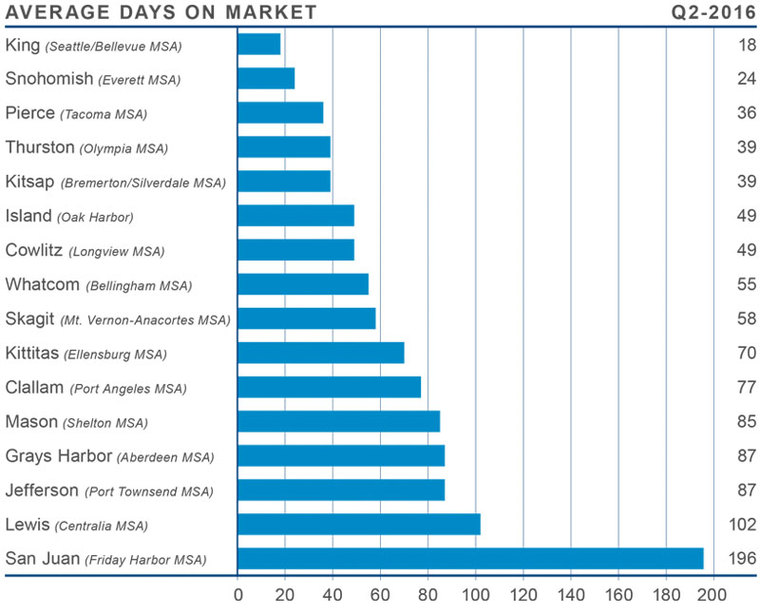
DAYS ON MARKET
- The average number of days it took to sell a home dropped by 17 days when compared to the second quarter of 2015.
- It took an average of 67 days to sell a home in the second quarter of this year—down from both the 86 days it took to sell a home in the first quarter of this year, and from the 84 days that it took to sell a home in the second quarter of 2015.
- The only market where the length of time it took to sell a home rose was in the notoriously fickle San Juan County, where it rose by 30 days to 196 days. In the rest of the region, the average decrease in the time it took to sell a home between the second quarter of 2015 and the second quarter of 2016 was 20 days.
- Snohomish County has joined King County as a market that takes less than a month to sell a home. At 18 days, King County is unarguably the hottest market in the region, but sales are slowing due to the lack of inventory. This imbalance is unsustainable over the long term.
 CONCLUSIONS
This speedometer reflects the state of the region’s housing market using housing inventory, price gains, sales velocities, interest rates, and larger economics factors. For the second quarter of 2016, I am leaving the needle in the same position as last quarter. Inventory levels have improved, albeit modestly, and price growth has slowed very slightly. However, this is offset by a jump in pending sales, a slightly higher number of closed sales, and a drop in interest rates. As such, the region remains staunchly a seller's market.

Matthew Gardner is the Chief Economist for Windermere Real Estate, specializing in residential market analysis, commercial/industrial market analysis, financial analysis, and land use and regional economics. He is the former Principal of Gardner Economics, and has over 25 years of professional experience both in the U.S. and U.K.
Source: www.windermere.com/blogs
