
 Facebook
 X
X
 Pinterest
 Copy Link
Western Washington Real Estate Market Update Q4 2019
The following analysis of the Western Washington real estate market is provided by Windermere Real Estate Chief Economist, Matthew Gardner. We hope that this information may assist you with making better-informed real estate decisions. For further information about the housing market in your area, please don’t hesitate to contact your Windermere agent.
ECONOMIC OVERVIEW
Employment in Washington State continues to soften; it is currently at an annual growth rate of 1.7%. I believe that is a temporary slowdown and we will see the pace of employment growth improve as we move further into the new year. It’s clear that businesses are continuing to feel the effects of the trade war with China and this is impacting hiring practices. This is, of course, in addition to the issues that Boeing currently faces regarding the 737 MAX.
In the fourth quarter of 2019 the state unemployment rate was 4.4%, marginally lower than the 4.5% level of a year ago. My most recent economic forecast suggests that statewide job growth in 2020 will rise 2.2%, with a total of 76,300 new jobs created.
HOME SALES
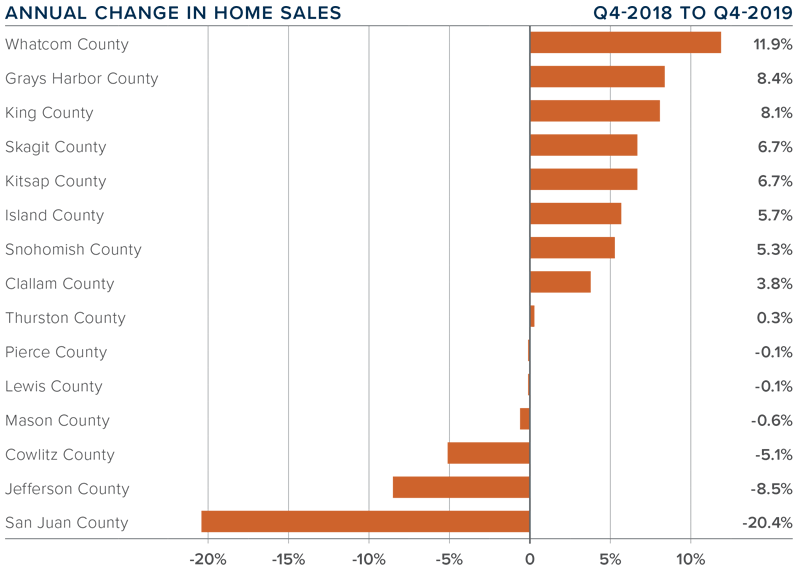
- There were 18,322 home sales registered during the final quarter of 2019, representing an impressive increase of 4.7% from the same period in 2018.
- Readers may remember that listing activity spiked in the summer of 2018 but could not be sustained, with the average number of listings continuing to fall. Year-over-year, the number of homes for sale in Western Washington dropped 31.7%.
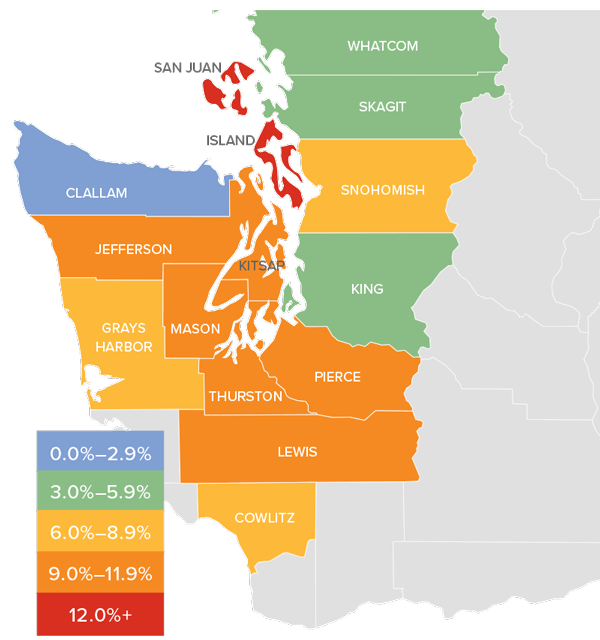
- Compared to the fourth quarter of 2018, sales rose in nine counties and dropped in six. The greatest growth was in Whatcom County. San Juan County had significant declines, but this is a very small market which makes it prone to extreme swings.
- Pending home sales — a barometer for future closings — dropped 31% between the third and fourth quarters of 2019, suggesting that we may well see a dip in the number of closed sales in the first quarter of 2020.
HOME PRICES
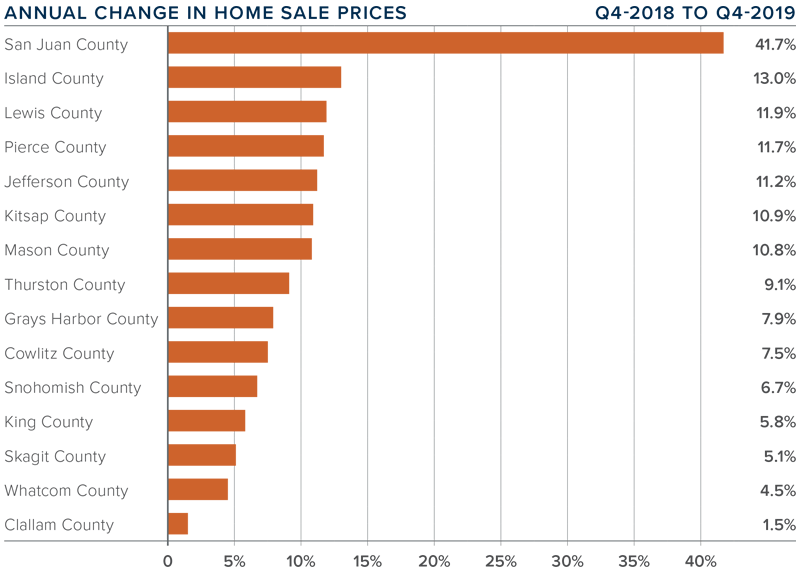
- Home price growth in Western Washington spiked during fourth quarter, with average prices 8.3% higher than a year ago. The average sale price in Western Washington was $526,564, 0.7% higher than in the third quarter of 2019.
- It’s worth noting that above-average price growth is happening in markets some distance from the primary job centers. I strongly feel this is due to affordability issues, which are forcing buyers farther out.
- Compared to the same period a year ago, price growth was strongest in San Juan County, where home prices were up 41.7%. Six additional counties also saw double-digit price increases.
- Home prices were higher in every county contained in this report. I expect this trend to continue in 2020, but we may see a softening in the pace of growth in some of the more expensive urban areas.
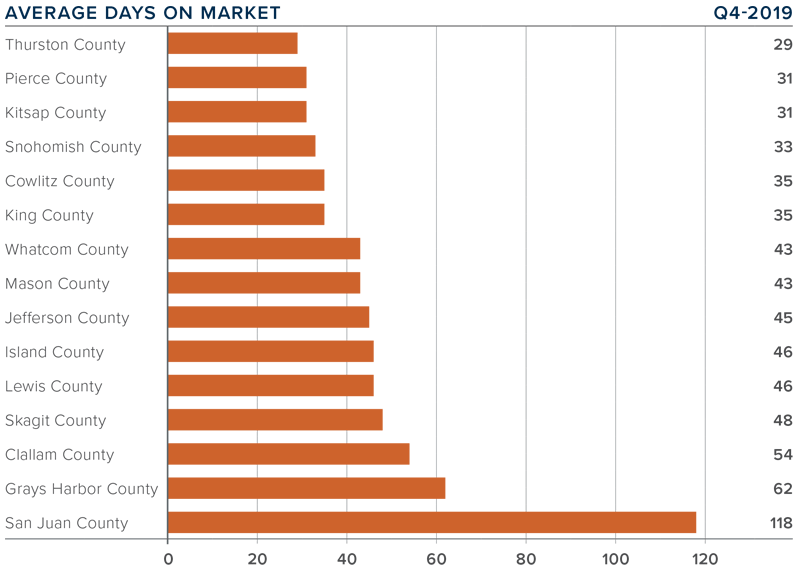
DAYS ON MARKET
- The average number of days it took to sell a home dropped four days compared to the third quarter of 2019.
- For the second quarter in a row, Thurston County was the tightest market in Western Washington, with homes taking an average of 29 days to sell. In nine counties, the length of time it took to sell a home dropped compared to the same period a year ago. Market time rose in four counties and two were unchanged.
- Across the entire region, it took an average of 47 days to sell a home in the fourth quarter. This was up nine days over the third quarter of this year.
- Market time remains below the long-term average across the region, a trend that will likely continue until we see more inventory come to market — possibly as we move through the spring.
CONCLUSIONS

This speedometer reflects the state of the region’s real estate market using housing inventory, price gains, home sales, interest rates, and larger economic factors.
The housing market ended the year on a high note, with transactions and prices picking up steam. I believe the uncertainty of 2018 (when we saw significant inventory enter the market) has passed and home buyers are back in the market. Unfortunately, buyers’ desire for more inventory is not being met and I do not see any significant increase in listing activity on the horizon. As such, I have moved the needle more in favor of home sellers.

As Chief Economist for Windermere Real Estate, Matthew Gardner is responsible for analyzing and interpreting economic data and its impact on the real estate market on both a local and national level. Matthew has over 30 years of professional experience both in the U.S. and U.K.
In addition to his day-to-day responsibilities, Matthew sits on the Washington State Governors Council of Economic Advisors; chairs the Board of Trustees at the Washington Center for Real Estate Research at the University of Washington; and is an Advisory Board Member at the Runstad Center for Real Estate Studies at the University of Washington where he also lectures in real estate economics.
This post originally appeared on the Windermere.com Blog.
Western Washington Real Estate Market Update Q3 2019


The following analysis of the Western Washington real estate market is provided by Windermere Real Estate Chief Economist, Matthew Gardner. We hope that this information may assist you with making better-informed real estate decisions. For further information about the housing market in your area, please don’t hesitate to contact your Windermere agent.
ECONOMIC OVERVIEW
Washington State employment has softened slightly to an annual growth rate of 2%, which is still a respectable number compared to other West Coast states and the country as a whole. In all, I expect that Washington will continue to add jobs at a reasonable rate though it is clear that businesses are starting to feel the effects of the trade war with China and this is impacting hiring practices. The state unemployment rate was 4.6%, marginally higher than the 4.4% level of a year ago. My most recent economic forecast suggests that statewide job growth in 2019 will rise by 2.2%, with a total of 88,400 new jobs created.
HOME SALES
- There were 22,685 home sales during the third quarter of 2019, representing a slight increase of 0.8% from the same period in 2018 and essentially at the same level as in the second quarter.
- Listing activity — which rose substantially from the middle of last year — appears to have settled down. This is likely to slow sales as there is less choice in the market.
- Compared to the third quarter of 2018, sales rose in five counties, remained static in one, and dropped in nine. The greatest growth was in Skagit and Clallam counties. Jefferson, Kitsap, and Cowlitz counties experienced significant declines.
- The average number of homes for sale rose 11% between the second and third quarters. However, inventory is 14% lower than in the same quarter of 2018. In fact, no county contained in this report had more homes for sale in the third quarter than a year ago.

HOME PRICES
- Home price growth in Western Washington notched a little higher in the third quarter, with average prices 4.2% higher than a year ago. The average sales price in Western Washington was $523,016. It is worth noting, though, that prices were down 3.3% compared to the second quarter of this year.
- Home prices were higher in every county except Island, though the decline there was very small.
- When compared to the same period a year ago, price growth was strongest in Grays Harbor County, where home prices were up 22%. San Juan, Jefferson, and Cowlitz counties also saw double-digit price increases.
- Affordability issues are driving buyers further out which is resulting in above-average price growth in outlying markets. I expect home prices to continue appreciating as we move through 2020, but the pace of growth will continue to slow.

DAYS ON MARKET
- The average number of days it took to sell a home dropped one day when compared to the third quarter of 2018.
- Thurston County was the tightest market in Western Washington, with homes taking an average of only 20 days to sell. There were six counties where the length of time it took to sell a home dropped compared to the same period a year ago. Market time rose in six counties, while two counties were unchanged.
- Across the entire region, it took an average of 38 days to sell a home in the third quarter. This was down 3 days compared to the second quarter of this year.
- Market time remains below the long-term average across the region and this trend is likely to continue until more inventory comes to market, which I do not expect will happen until next spring.

CONCLUSIONS

This speedometer reflects the state of the region’s real estate market using housing inventory, price gains, home sales, interest rates, and larger economic factors. I am leaving the needle in the same position as the first and second quarters, as demand appears to still be strong.
The market continues to benefit from low mortgage rates. The average 30-year fixed rates is currently around 3.6% and is unlikely to rise significantly anytime soon. Even as borrowing costs remain very competitive, it’s clear buyers are not necessarily jumping at any home that comes on the market. Although it’s still a sellers’ market, buyers have become increasingly price-conscious which is reflected in slowing home price growth.
ABOUT MATTHEW GARDNER
 As Chief Economist for Windermere Real Estate, Matthew Gardner is responsible for analyzing and interpreting economic data and its impact on the real estate market on both a local and national level. Matthew has over 30 years of professional experience both in the U.S. and U.K.
In addition to his day-to-day responsibilities, Matthew sits on the Washington State Governors Council of Economic Advisors; chairs the Board of Trustees at the Washington Center for Real Estate Research at the University of Washington; and is an Advisory Board Member at the Runstad Center for Real Estate Studies at the University of Washington where he also lectures in real estate economics.
