Book ClubSeasonalWindermere Bellevue Commons News September 2, 2023

Home Sweet Home

Welcome to the WBC Book Club, where your favorite Admins & Agents share our favorite books of the moment! From fictional adventures to inspiring true stories, you can find it all right here on the WBC blog. You may notice that the format of our book recs look a little different than most, but that’s because our team loves to stand out and provide an unparalleled experience in all aspects of our business.

This month’s Literary Listings are all about the places we call home, whether it be a glamourous pied-a-terre in Paris, a hauntingly beautiful estate in the English countryside, or a traditional colonial on the hill. Houses are the overlooked characters of our favorite stories, bearing witness to private conversations, clandestine meetings and secret dreams. It makes you wonder what these homes might have to say if walls could talk…


The Dutch House by Ann Patchett


Marketing Remarks: Now is your chance to own a bit of Pennsylvania history! Built by the illustrious VanHoebeek family in 1922, this Dutch colonial home with period details is in pristine condition. Enjoy evening soirees in the third floor ballroom and relax by the pool all summer long. This property spans several acres and offers unobstructed territorial views from the floor to ceiling windows. All art and furniture is conveyed with the house, including several priceless portraits that trace the long history of this amazing home.

Agent Remarks: Spanning more than three decades, The Dutch House chronicles the lives of Maeve and Danny Conroy, siblings who suddenly find themselves orphaned and disinherited by their stepmother after the untimely death of their father. With enough acerbic wit to counter the more sober themes, this is a beautiful coming of age story about love, forgiveness and the unbreakable bonds of family, reminding us that home is not where you are, it is who you are with.

Directions: Read the synopsis here!


The Paris Apartment by Lucy Foley


Marketing Remarks: Quiet and secluded baroque pied-a-terre close to local amenities. Secure passcode entry & on-site concierge to monitor all deliveries, building maintenance and mysterious goings-on. Building features include a lovely courtyard, hidden passageways, a wine cellar with convenient storage area – but beware, it’s easy to get locked in down there if you aren’t careful. Enjoy timeless elegance at one the most sought-after apartment buildings in Paris.

Agents Remarks: A suspenseful guessing game where no one is ever truly what they seem, The Paris Apartment takes you on a twisting investigation through the streets of Paris as a young woman attempts to find her missing brother. Then tension builds as we meet his various neighbors, each of whom seem to have a reason for wanting the charismatic, aspiring journalist out of the picture. This book has mystery, childhood trauma, and revenge – all the makings of a classic thriller!

Directions: Read the synopsis here!


Northanger Abbey by Jane Austen


Marketing Remarks: Step back in time to this 12th century abbey situated in the idyllic English countryside. This estate has been lovingly restored and repurposed into a family residence while keeping the building’s original architectural details intact. Arching gothic windows let in plenty of natural light to chase away any ghostly shadows, while the grand Rumford fireplace creates a cozy atmosphere in the spacious drawing room. It would be an alleged crime to pass up on this amazing opportunity!

Agent Remarks: Jane Austen’s first published work, Northanger Abbey satirizes the popular gothic novel that was sweeping the literary world in the 1800s. It follows a lovable yet naïve heroine, Catherine, who finds herself caught in a tug-of-war of friendship and romance with two very different sibling duos. When invited to visit her friends’ ancestral home, Catherine’s imagination takes flight as she searches for ghostly apparitions and murderous schemes around every turn. Expectations are turned upside down, relationships are tested and true natures revealed in this hilarious romp. This is a palatable book for those new to the work of Jane Austen and a great read for passing dark, stormy evenings.

Directions: Read the synopsis here!


What should we read next? We are always on the lookout for new book recommendations and would love to hear from you – tag us on social media with your favorite stories!

Instagram @windermerebellevuecommons
Twitter @WindermereBelle
Facebook @Bellevue Commons (Windermere) 


Written by Makena Schoene


Market StatsWindermere Bellevue Commons News November 2, 2017

Greater Seattle Area Real Estate Market – 3rd Quarter 2017

The Gardner Report – Third Quarter 2017


ECONOMIC OVERVIEW

The Washington State economy added 79,600 new jobs over the past 12 months—an impressive growth rate of 2.4%, and well above the national growth rate of 1.2%. However, as we anticipated in last quarter’s report, we continue to see a modest slowdown in the growth rate as the state grows closer to full employment. Growth has been broad-based, with expansion in all major job sectors other than Aerospace (a function of a slowdown at Boeing). Given the current rate of expansion, I am raising my employment forecast and now predict that Washington will add 81,000 new jobs in 2017.

Given the robust job market, it is unsurprising that the state unemployment rate continues to fall. The current unemployment rate in Washington State is 4.6% and we are essentially at full employment. Additionally, all counties contained within this report reported either a drop or stability in their unemployment rate from a year ago. I maintain my belief that the Washington State economy will continue to outperform the U.S. as a whole. Given such a strong expansion, we should also expect solid income growth across Western Washington.


HOME SALES ACTIVITY

  • There were 25,312 home sales during the third quarter of 2017. This is an increase of 3.6% over the same period in 2016.
  • Clallam County maintains its number one position for sales growth over the past 12 months. Only four other counties saw double-digit gains in sales. This demonstrates continuing issues with the low supply of listings. There were modest declines in sales activity in six counties.
  • The market remains remarkably tight with listing inventory down by 14.2% when compared to the third quarter of 2016. But inventory is up a significant 32% compared to the second quarter of this year. Pending sales rose by 5.2% over the same quarter a year ago, which suggests that closings in Q4 will still be robust.
  • The key takeaway from this data is that inventory is still very low, and the situation is unlikely to improve through the balance of the year.


HOME PRICES

  • Given tight supply levels, it is unsurprising to see very solid price growth across the Western Washington counties. Year-over-year, average prices rose 12.3% to $474,184. This is 0.9% higher than seen in the second quarter of this year.
  • With demand far exceeding supply, price growth in Western Washington continues to trend well above the longterm average. As I do not expect to see the new home market expand at any significant pace, there will be continued pressure on the resale market, which will cause home prices to continue to rise at above-average rates.
  • When compared to the same period a year ago, price growth was most pronounced in Grays Harbor County where sale prices were 20.1% higher than the third quarter of 2016. Nine additional counties experienced double-digit price growth.
  • Mortgage rates in the quarter continue to test the lows of 2017, and this is unlikely to change in the near-term. This will allow home prices to escalate further but I expect we will see rates start to rise fairly modestly in 2018, which could slow price growth.


DAYS ON MARKET

  • The average number of days it took to sell a home in the quarter dropped by eight days when compared to the same quarter of 2016.
  • King County continues to be the tightest market, with homes taking an average of 17 days to sell. Every county except San Juan saw the days on market drop from the same period a year ago.
  • This quarter, it took an average of 43 days to sell a home. This is down from the 51 days it took in the second quarter of 2016 and down by 8 days from the second quarter of this year.
  • At some point, inventory will start to grow and this will lead to an increase in the average time it takes to sell a house. However, I do not expect that to happen at any time soon. So we remain in a seller’s market.


CONCLUSIONS

This speedometer reflects the state of the region’s housing market using housing inventory, price gains, home sales, interest rates, and larger economic factors. For the third quarter of 2017, I have left the needle at the same point as the second quarter. Though price growth remains robust, sales activity has slowed very slightly and listings jumped relative to the second quarter. That said, the market is very strong and buyers will continue to find significant competition for accurately priced and well-located homes.


ABOUT MATTHEW GARDNER

Matthew Gardner is the Chief Economist for Windermere Real Estate, specializing in residential market analysis, commercial/industrial market analysis, financial analysis, and land use and regional economics. He is the former Principal of Gardner Economics, and has more than 30 years of professional experience both in the U.S. and U.K.


Market StatsWindermere Bellevue Commons News September 14, 2017

King & Snohomish County Market Stats – August 2017


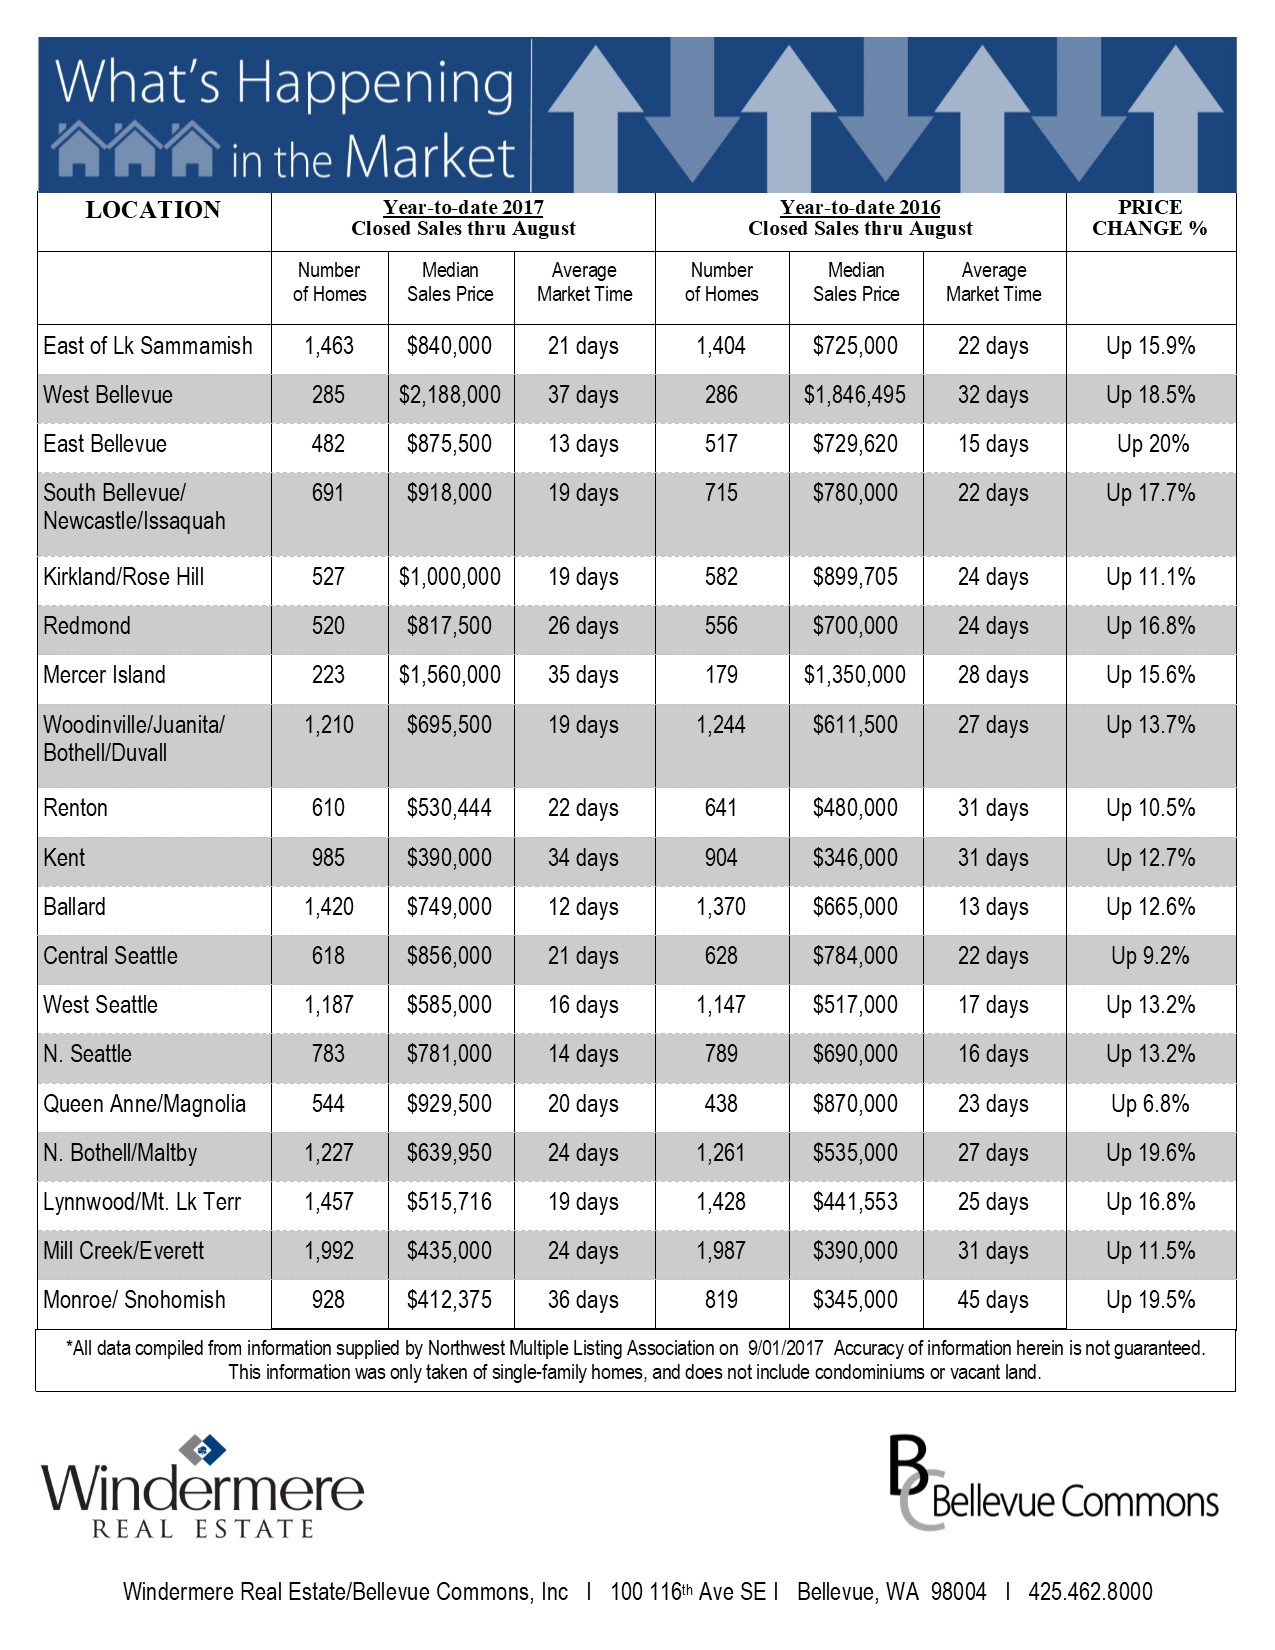
What’s Happening in the Market

Eastside (based on Residential Homes):

Low Inventory

The Real Estate market in August 2017 showed signs of slowing down, but it was interesting to see as home inventory fell, homes under $1.5M on the eastside were still selling at a fast pace while the upper end Buyers were being much pickier.


Less Sail-Fails

Another interesting thing to note was that Sale fails were continuing to drop which is a credit to more qualified Buyers and tighter contracts that are required when competing in a multiple offer situations.  It also was because of the pre-inspections being done before writing offers instead of requiring Buyers to find deficiencies and then renegotiate the terms of the contract.

Market StatsWindermere Bellevue Commons News July 26, 2017

The Gardner Report – 2nd Quarter 2017

The Gardner Report | Western Washington Q2 2017


The following analysis of the Western Washington real estate market is provided by Windermere Real Estate Chief Economist Matthew Gardner. We hope that this information may assist you with making better-informed real estate decisions. For further information about the housing market in your area, please don’t hesitate to contact me.

ECONOMIC OVERVIEW


The Washington State economy has been expanding at a rapid pace but we are seeing a slowdown as the state grows closer to full employment. Given the solid growth, I would expect to see income growth move markedly higher, though this has yet to materialize. I anticipate that we will see faster income growth in the second half of the year. I still believe that the state will add around 70,000 jobs in 2017.

Washington State, as well as the markets that make up Western Washington, continue to see unemployment fall. The latest state-wide report now shows a rate of 4.5%—the lowest rate since data started to be collected in 1976.

I believe that growth in the state will continue to outperform the U.S. as a whole and, with such robust expansion, I would not be surprised to see more people relocate here as they see Washington as a market that offers substantial opportunity.

HOME SALES ACTIVITY


  • There were 23,349 home sales during the second quarter of 2017. This is an increase of 1.1% from the same period in 2016.
  • Clallam County maintains its position as number one for sales growth over the past 12 months. Double-digit gains in sales were seen in just three other counties, which is a sharp drop from prior reports. I attribute this to inventory constraints rather than any tangible drop in demand. The only modest decline in sales last quarter was seen in Grays Harbor County.
  • The number of homes for sale, unfortunately, showed no improvement, with an average of just 9,279 listings in the quarter, a decline of 20.4% from the second quarter of 2016. Pending sales rose by 3.6% relative to the same quarter a year ago.
  • The key takeaway from this data is that it is unlikely we will see a significant increase in the number of homes for sale for the rest of 2017.
Annual Change in Home Sales

HOME PRICES


  • Along with the expanding economy, home prices continue to rise at very robust rates. Year-over-year, average prices rose 14.9%. The region’s average sales price is now $470,187.
  • Price growth in Western Washington continues to impress as competition for the limited number of homes for sale remains very strong. With little easing in supply, we anticipate that prices will continue to rise at above long-term averages.
  • When compared to the same period a year ago, price growth was most pronounced in San Juan County where sale prices were 29.2% higher than second quarter of 2016. Eight additional counties experienced double-digit price growth.
  • The specter of rising interest rates failed to materialize last quarter, but this actually functioned to get more would-be buyers off the fence and into the market. This led to even more demand which translated into rising home prices.
Western Washington Heat Map
Annual Change in Home Sale Prices

DAYS ON MARKET


  • The average number of days it took to sell a home in the quarter dropped by 18 days when compared to the same quarter of 2016.
  • King County remains the tightest market; homes, on average, sold in a remarkable 15 days. Every county in this report saw the length of time it took to sell a home drop from the same period a year ago.
  • Last quarter, it took an average of 48 days to sell a home. This is down from the 66 days it took in the second quarter of 2016.
  • Given the marked lack of inventory, I would not be surprised to see the length of time it takes to sell a home drop further before the end of the year.
Average Days on Market

CONCLUSIONS


Market Speedometer
This speedometer reflects the state of the region’s housing market using housing inventory, price gains, home sales, interest rates, and larger economic factors. For the second quarter of 2017, I moved the needle a little more in favor of sellers. To define the Western Washington market as “tight” is somewhat of an understatement. Inventory is short and buyers are plentiful. Something must give, but unless we see builders delivering substantially more units than they have been, it will remain staunchly a sellers’ market for the balance of the year. Furthermore, increasing mortgage rates have failed to materialize and, with employment and income growth on the rise, the regional housing market will continue to be very robust.

ABOUT MATTHEW GARDNER


Matthew Gardner is the Chief Economist for Windermere Real Estate, specializing in residential market analysis, commercial/industrial market analysis, financial analysis, and land use and regional economics. He is the former Principal of Gardner Economics, and has more than 30 years of professional experience both in the U.S. and U.K.
Market StatsWindermere Bellevue Commons News May 18, 2017

The Gardner Report – First Quarter 2017

The Gardner Report – First Quarter 2017

Economic Overview

I’m happy to report that Washington State continues to add jobs at a steady rate. While the rate of growth is tapering, this is because many markets are getting close to “full employment”, during which time growth naturally slows. That said, I believe that the state will add around 70,000 jobs in 2017. Washington State, as well as the markets that make up Western Washington, continues to see unemployment fall and I anticipate that we will see this rate drop further as we move through the year. In all, the economy continues to perform at or above average levels and 2017 will be another growth year.

Home Sales

  • There were 15,652 home sales during the first quarter of 2017. This is an increase of 9.5% from the same period in 2016, but 20.7% below the total number of sales in the final quarter of 2016.
  • With an increase of 45.5%, sales in Clallam County grew at the fastest rate over the past 12 months. There were double-digit gains seen in an additional 10 counties, suggesting that demand remains very robust. The only modest decline in sales was seen in Grays Harbor County.
  • The number of homes for sale showed no improvement at all, with an average of just 6,893 homes for sale in the quarter, a decline of 33% from the previous quarter and 25% from the first quarter of 2016. Pending sales rose by 2% relative to the same quarter a year ago.
  • The key takeaway from this data is that 2017 will offer little relief to would-be home buyers as the housing supply remains severely constrained.

Home Prices

  • With demand continuing to exceed supply, home prices continued to rise at above-average rates. Year-over-year, average prices rose by 9.5% but were 1.1% lower than in the final quarter of 2016. The region’s average sales price is now $409,351.
  • Price growth in Western Washington is unlikely to taper dramatically in 2017 and many counties will continue to see prices appreciate well above their long-term averages.
  • When compared to the same period a year ago, price growth was most pronounced in Kittitas County, which rose by 19.6%. Double-digit price growth was seen in an additional 10 counties. The only market where the average price fell was in the ever-volatile San Juan County.
  • It is clear that rising interest rates have not taken much of a sheen off the market.

Days on Market

  • The average number of days it took to sell a home in the first quarter dropped by 16 days when compared to the first quarter of 2016.
  • King County remained the tightest market, with the average time to sell a home at just 31 days. Island County was the only area where it took longer to sell a home than seen a year ago; however, the increase was just one day.
  • In the first quarter of the year, it took an average of 70 days to sell a home. This is down from the 86 days it took in the first quarter of 2016, but up from the 64 days it took in the final quarter of last year.
  • Given woefully low levels of inventory in all Western Washington markets, I do not expect to see the length of time that it takes to sell a home rising in 2017. In fact, it is likely that it will continue to drop.

Conclusions

This speedometer reflects the state of the region’s housing market using housing inventory, price gains, home sales, interest rates, and larger economic factors. For the first quarter of 2017, I moved the needle a little more in favor of sellers. The rapid increase in mortgage rates during the fourth quarter of 2016 has slowed and buyers are clearly out in force.

This article originally appeared on the Windermere.com blog.

Home SellingWindermere Bellevue Commons News April 26, 2017

3 Charts That Shout, ‘List Your Home Today!’

3 Charts That Shout, ‘List Your Home Today!’ | MyKCM

In school, we all learned the theory of supply and demand. When the demand for an item is greater than the supply of that item, the price will surely rise.

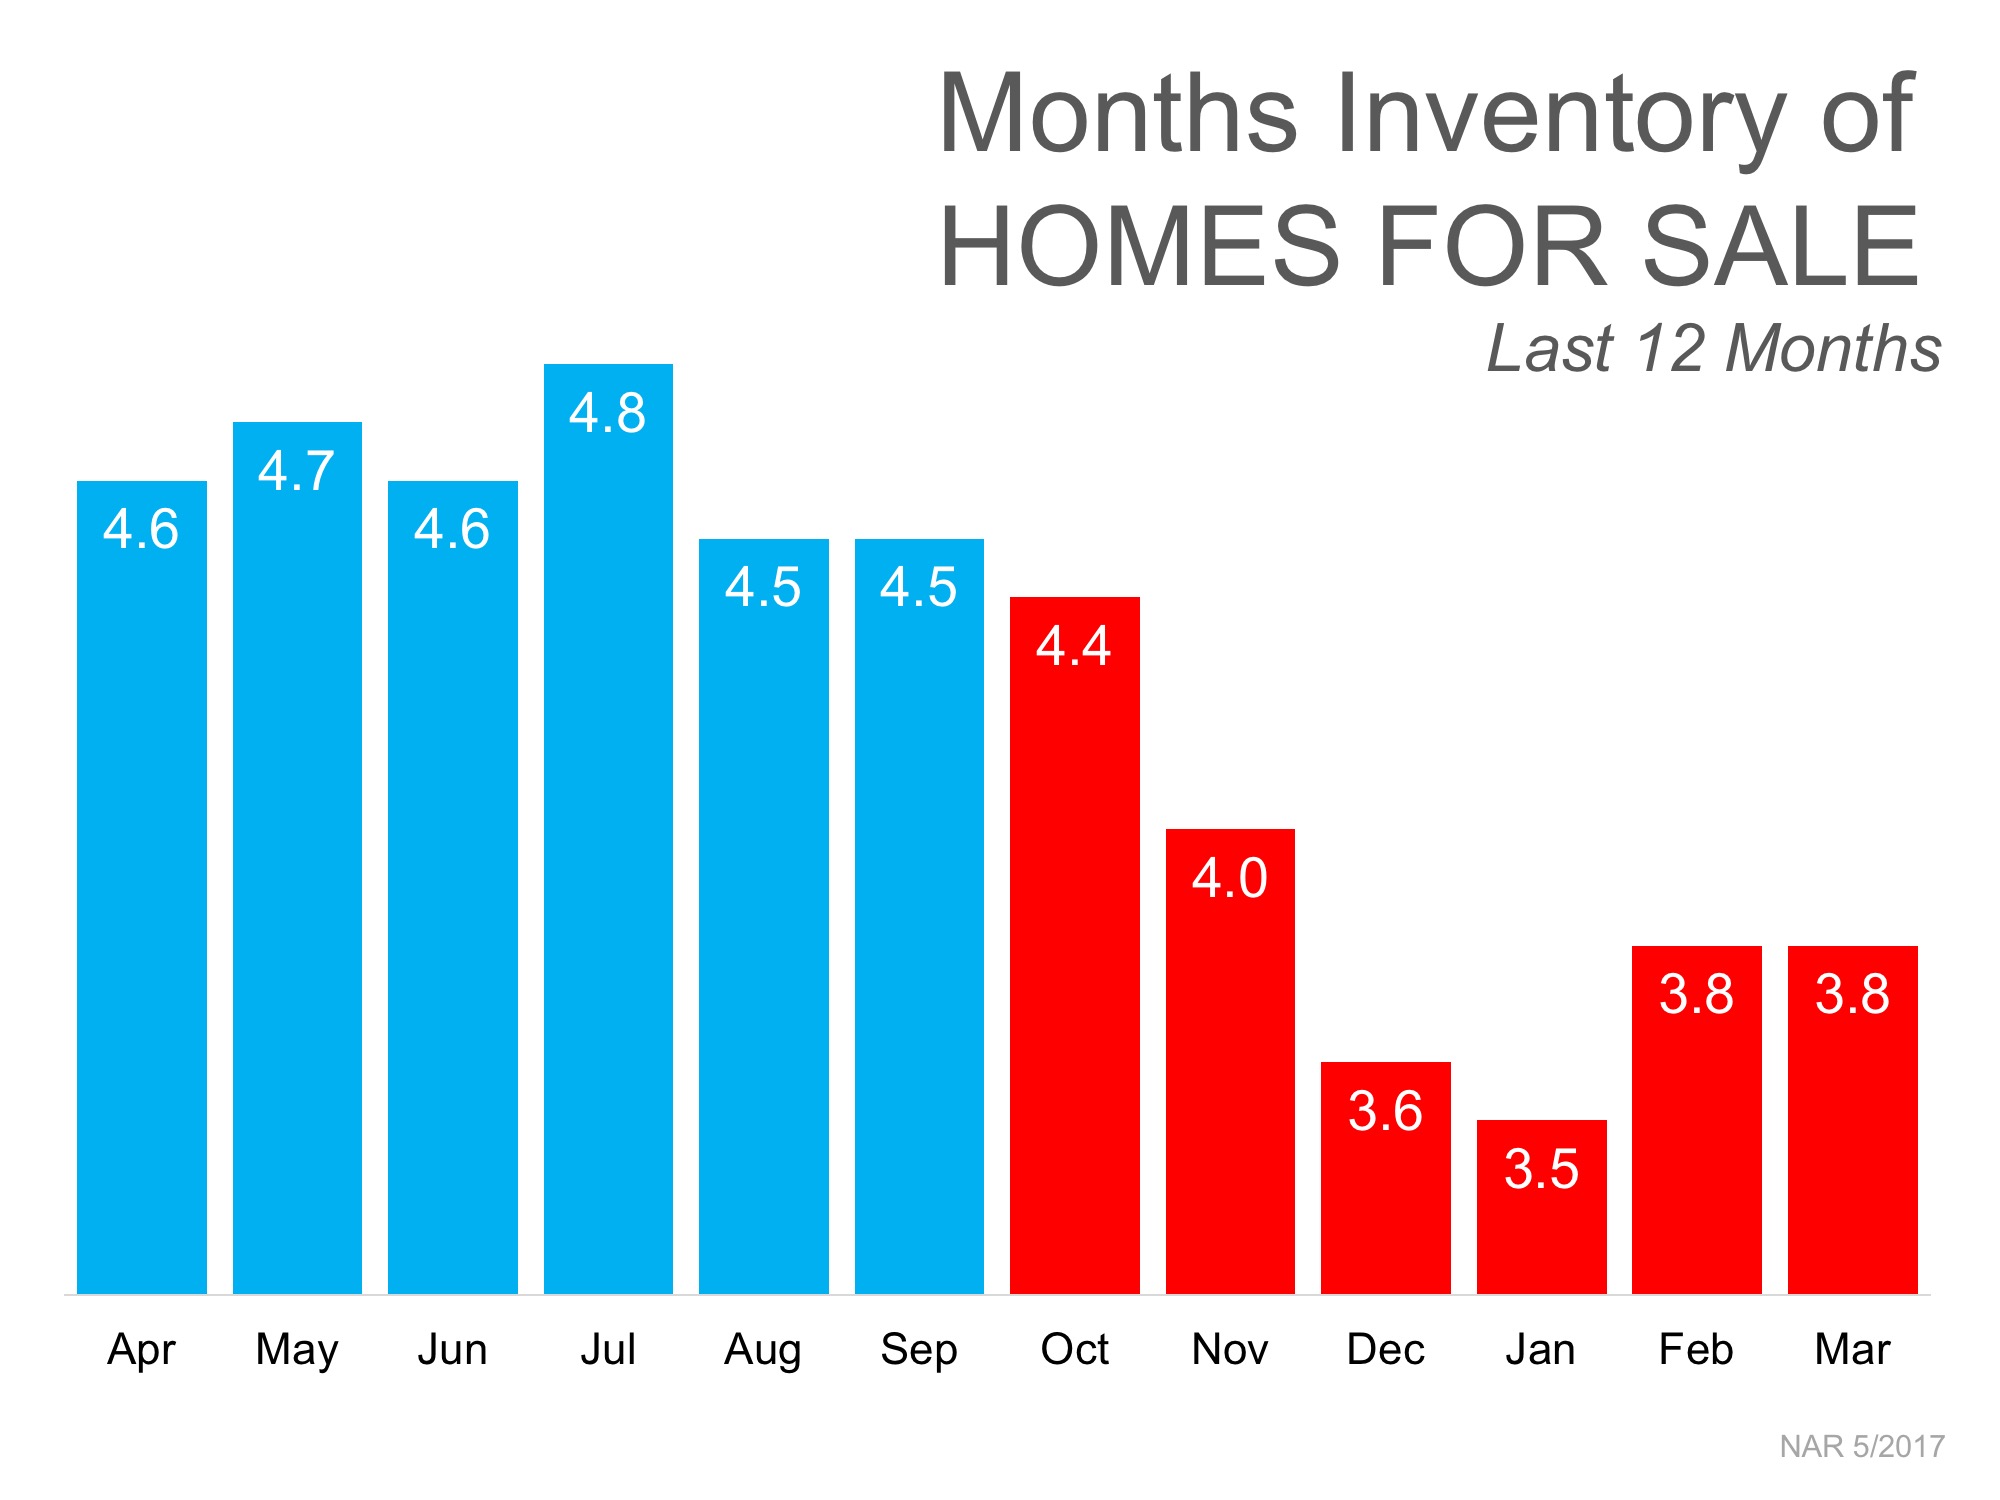
SUPPLY

The National Association of Realtors (NAR) recently reported that the inventory of homes for sale stands at a 3.8-month supply. This is considerably lower than the 6-month supply necessary for a normal market.

3 Charts That Shout, ‘List Your Home Today!’ | MyKCM


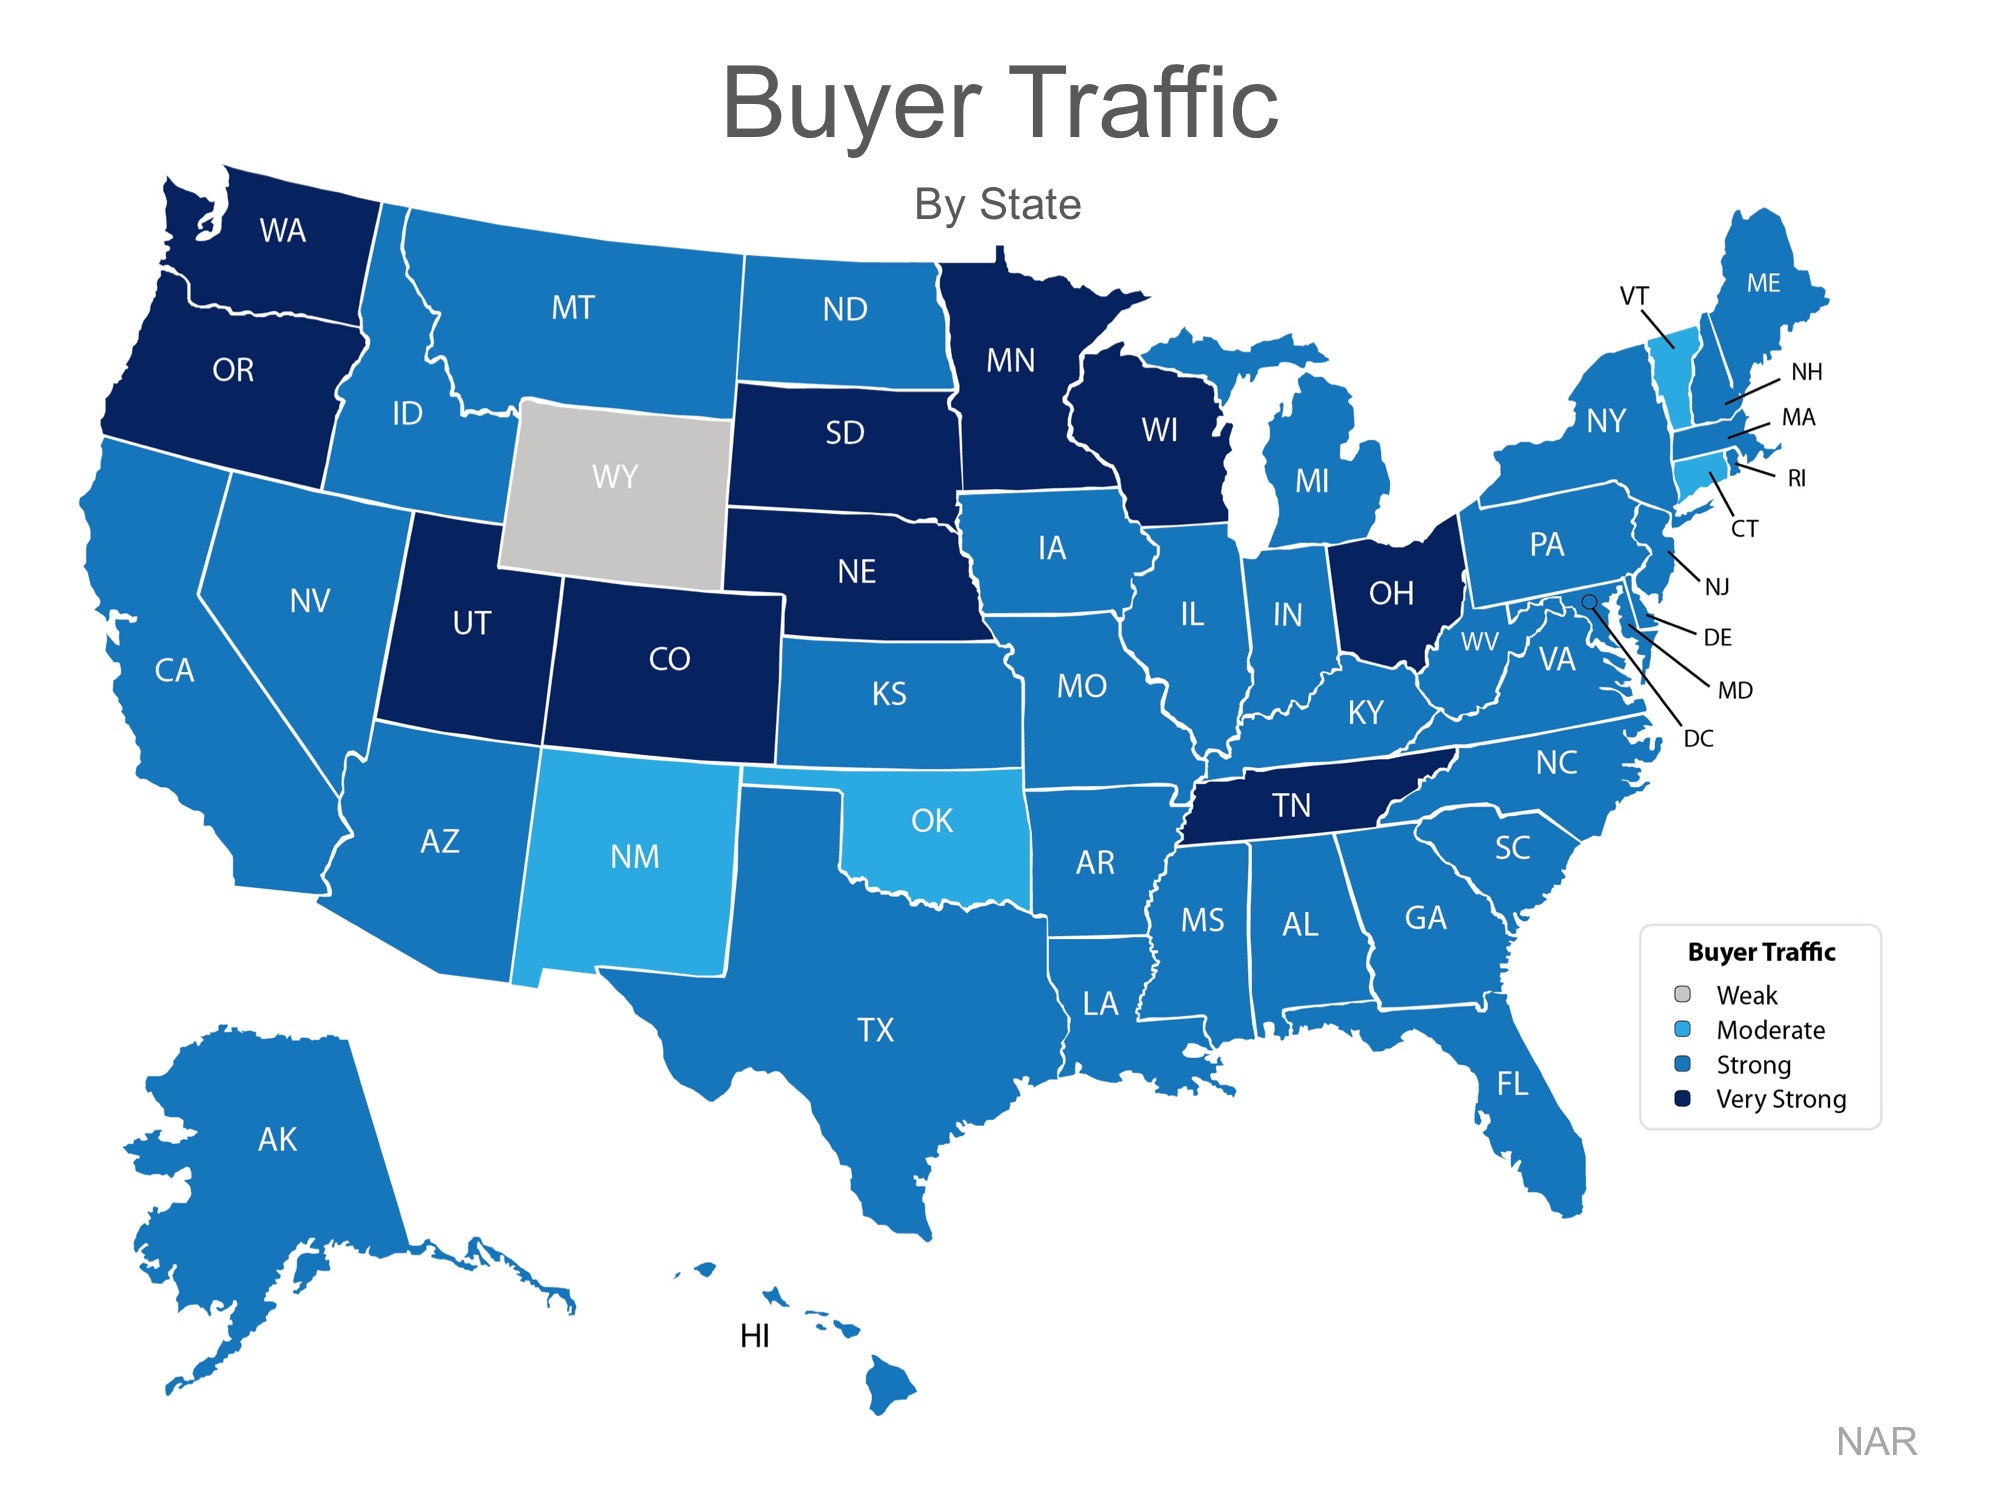
DEMAND

Every month NAR reports on the number of buyers out in the market looking for homes, which is also known as buyer traffic. As seen on the map below, buyer demand in March was strong or very strong in 45 out of 50 states nationwide, and Washington, DC.

3 Charts That Shout, ‘List Your Home Today!’ | MyKCM

Many buyers are being confronted with a very competitive market in which they must compete with other buyers for their dream homes (if they are even able to find a home they wish to purchase).

Listing your house for sale now will allow you to capitalize on the shortage of homes for sale in the market, which will translate into a better pricing situation.

HOME EQUITY

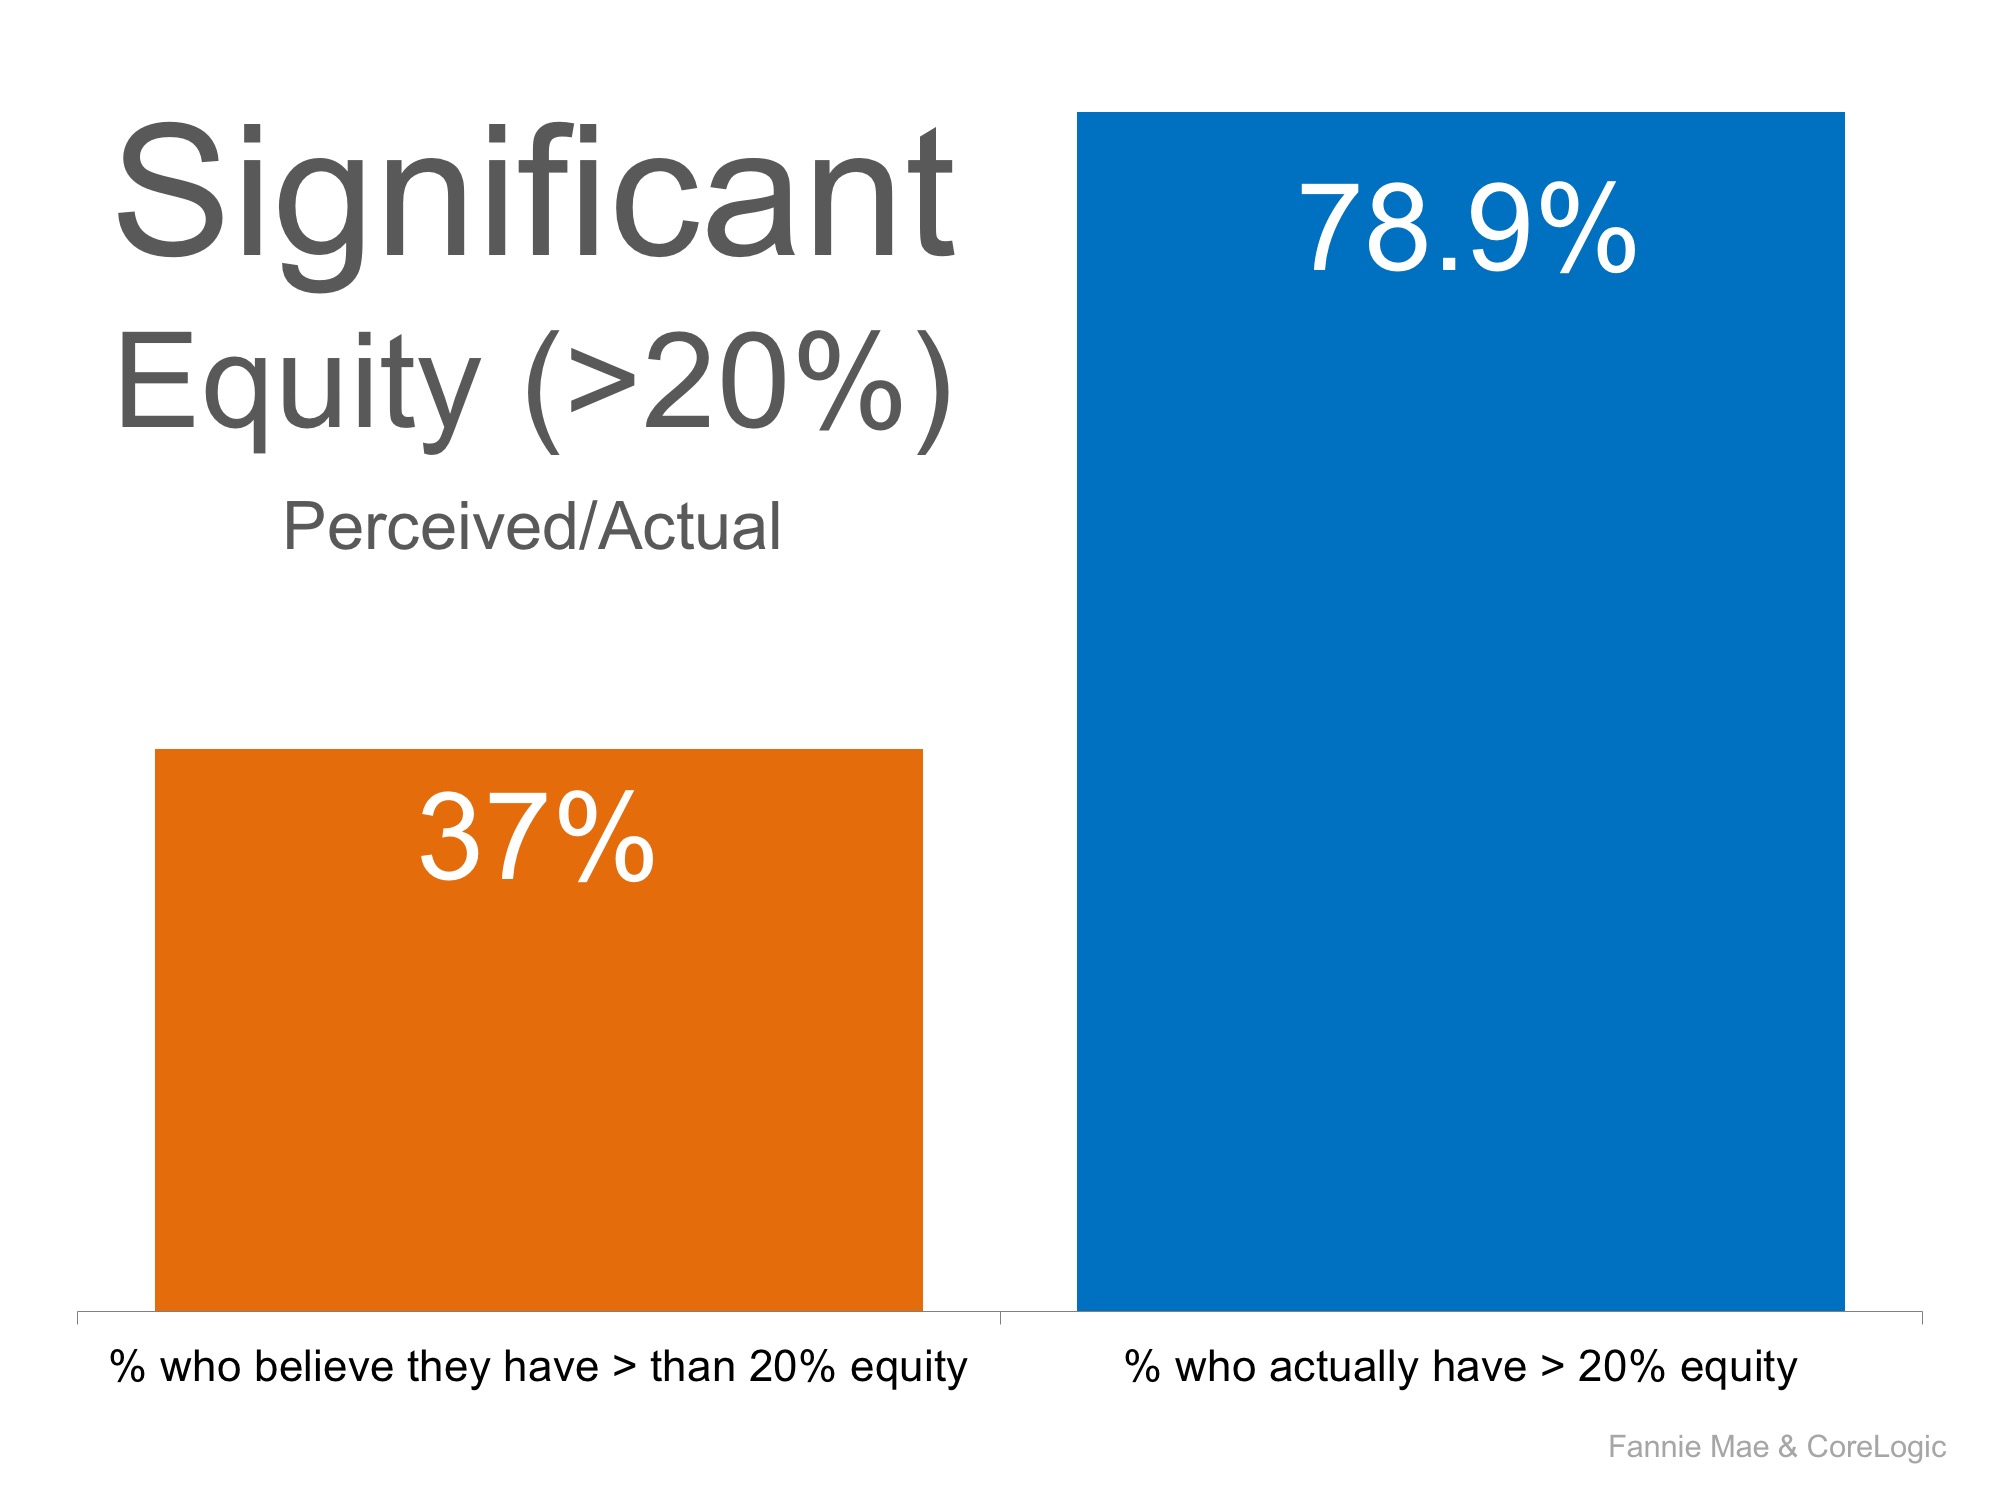
Many homeowners underestimate the amount of equity they currently have in their homes. According to a recent Fannie Mae study, 37% of homeowners believe that they have more than 20% equity in their homes. In reality, CoreLogic’s latest Equity Report tells us that 78.9% actually do!

3 Charts That Shout, ‘List Your Home Today!’ | MyKCM

Many homeowners who are undervaluing the equity they have in their homes may feel trapped, which may be contributing to the lack of inventory in the market.

Home BuyingWindermere Bellevue Commons News April 26, 2017

How Fast Can You Save for a Down Payment?

How Fast Can You Save for a Down Payment? | MyKCM

Saving for a down payment is often the biggest hurdle for a first-time homebuyer. Depending on where you live, median income, median rents, and home prices all vary. So, we set out to find out how long would it take you to save for a down payment in each state?

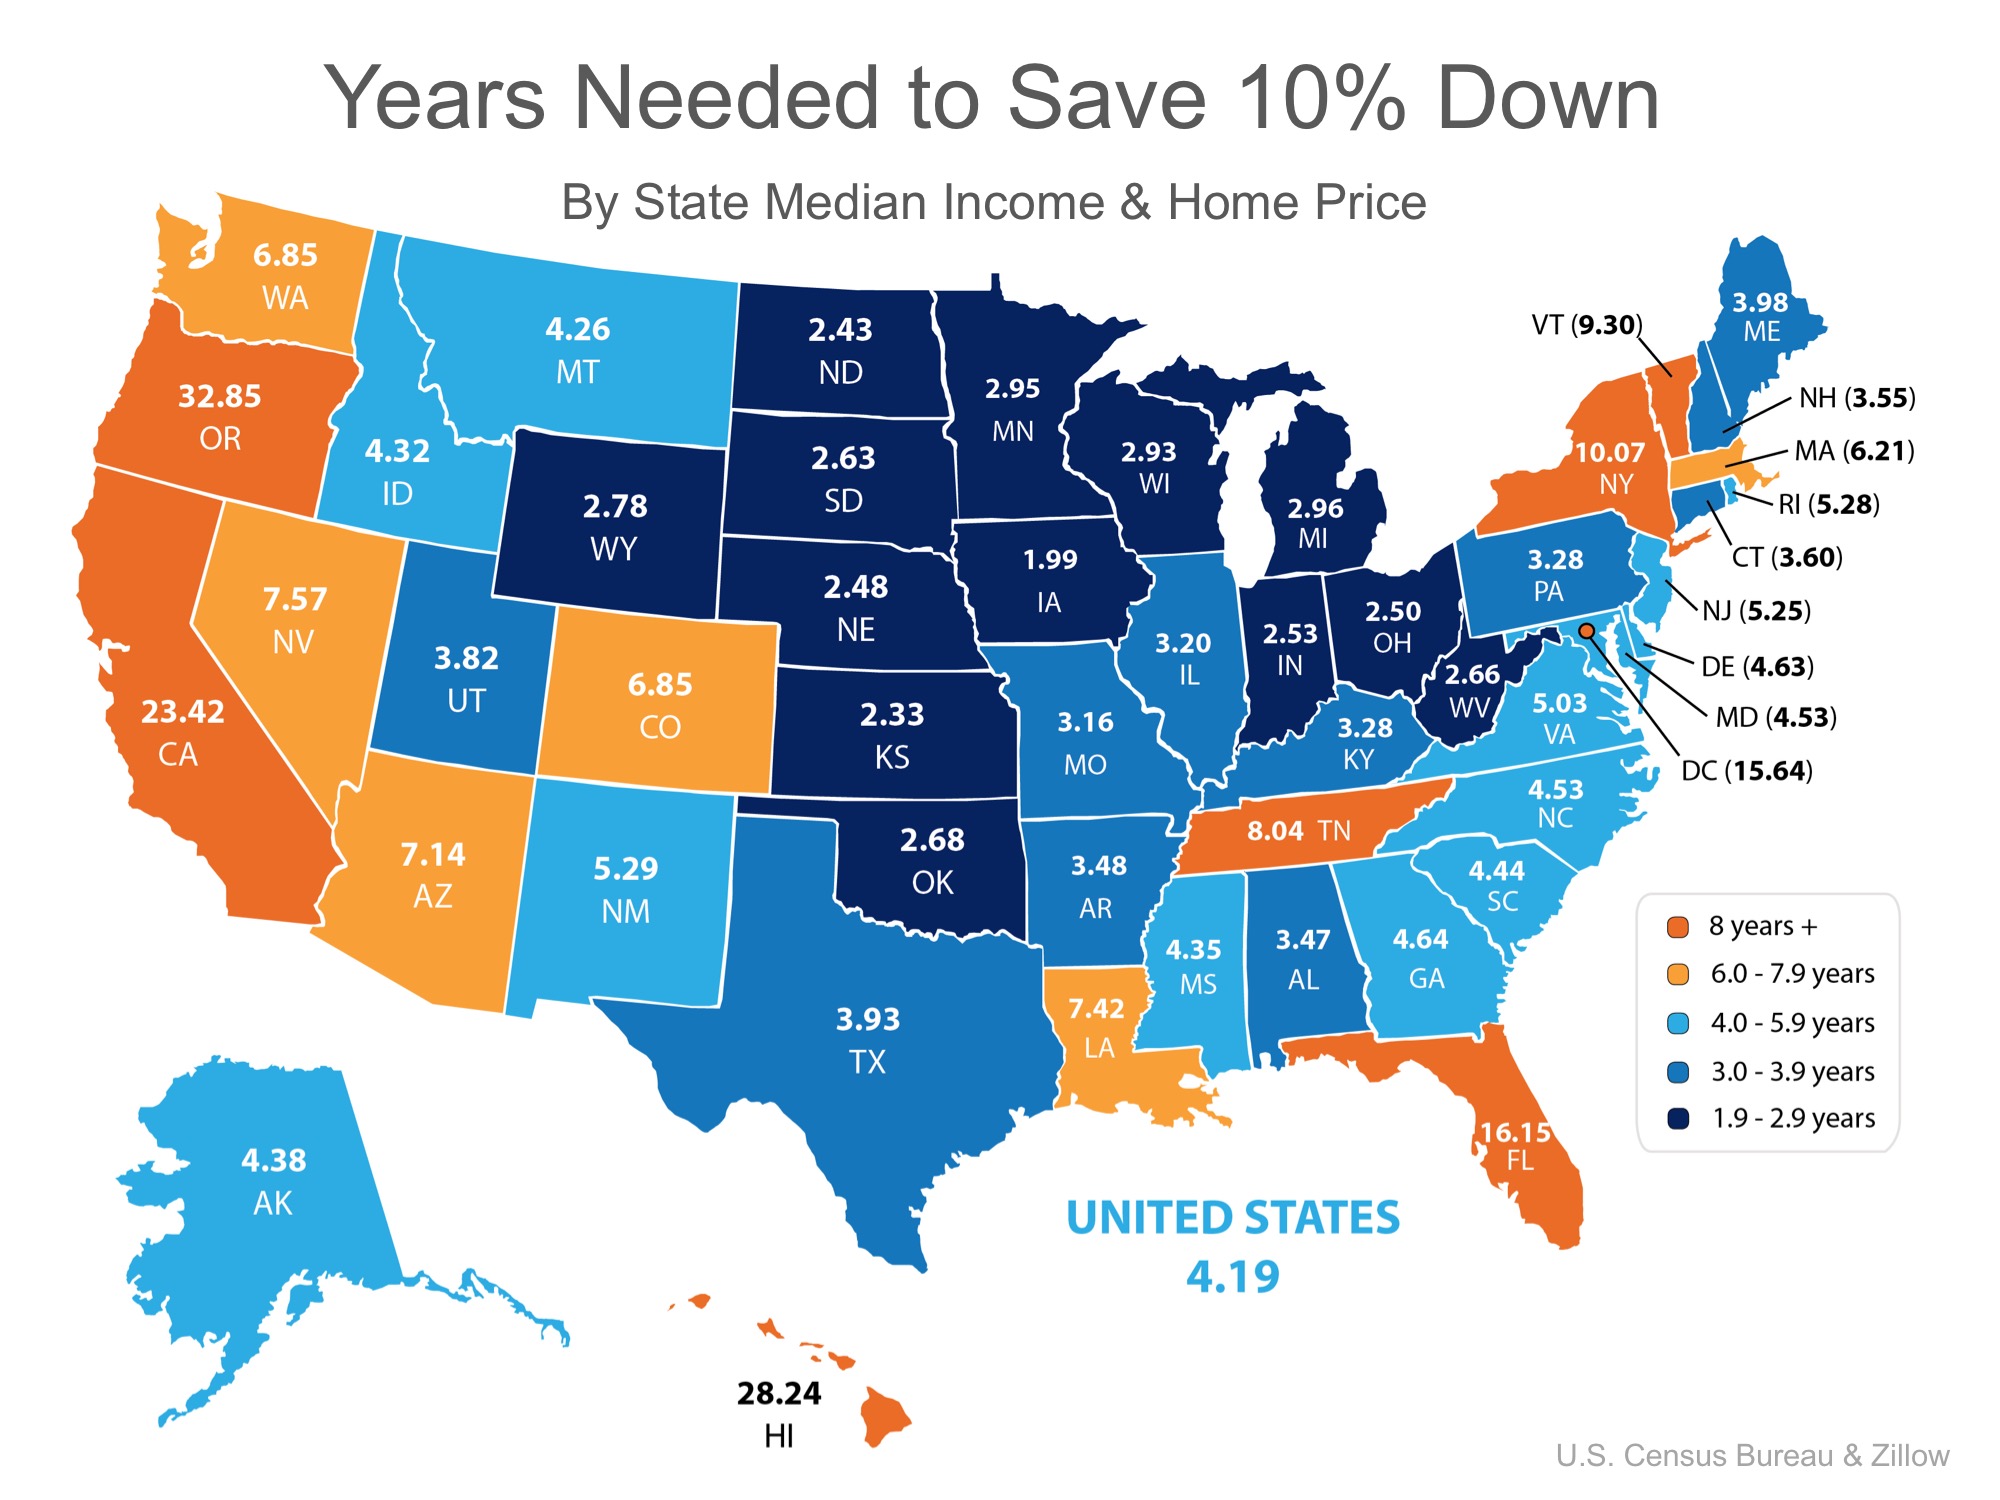
Using data from the United States Census Bureau and Zillow, we determined how long it would take, nationwide, for a first-time buyer to save enough money for a down payment on their dream home. There is a long-standing ‘rule’ that a household should not pay more than 28% of their income on their monthly housing expense.

By determining the percentage of income spent renting a 2-bedroom apartment in each state, and the amount needed for a 10% down payment, we were able to establish how long (in years) it would take for an average resident to save enough money to buy a home of their own.

According to the data, residents in Iowa can save for a down payment the quickest in just under 2 years (1.99). Below is a map created using the data for each state:

How Fast Can You Save for a Down Payment? | MyKCM

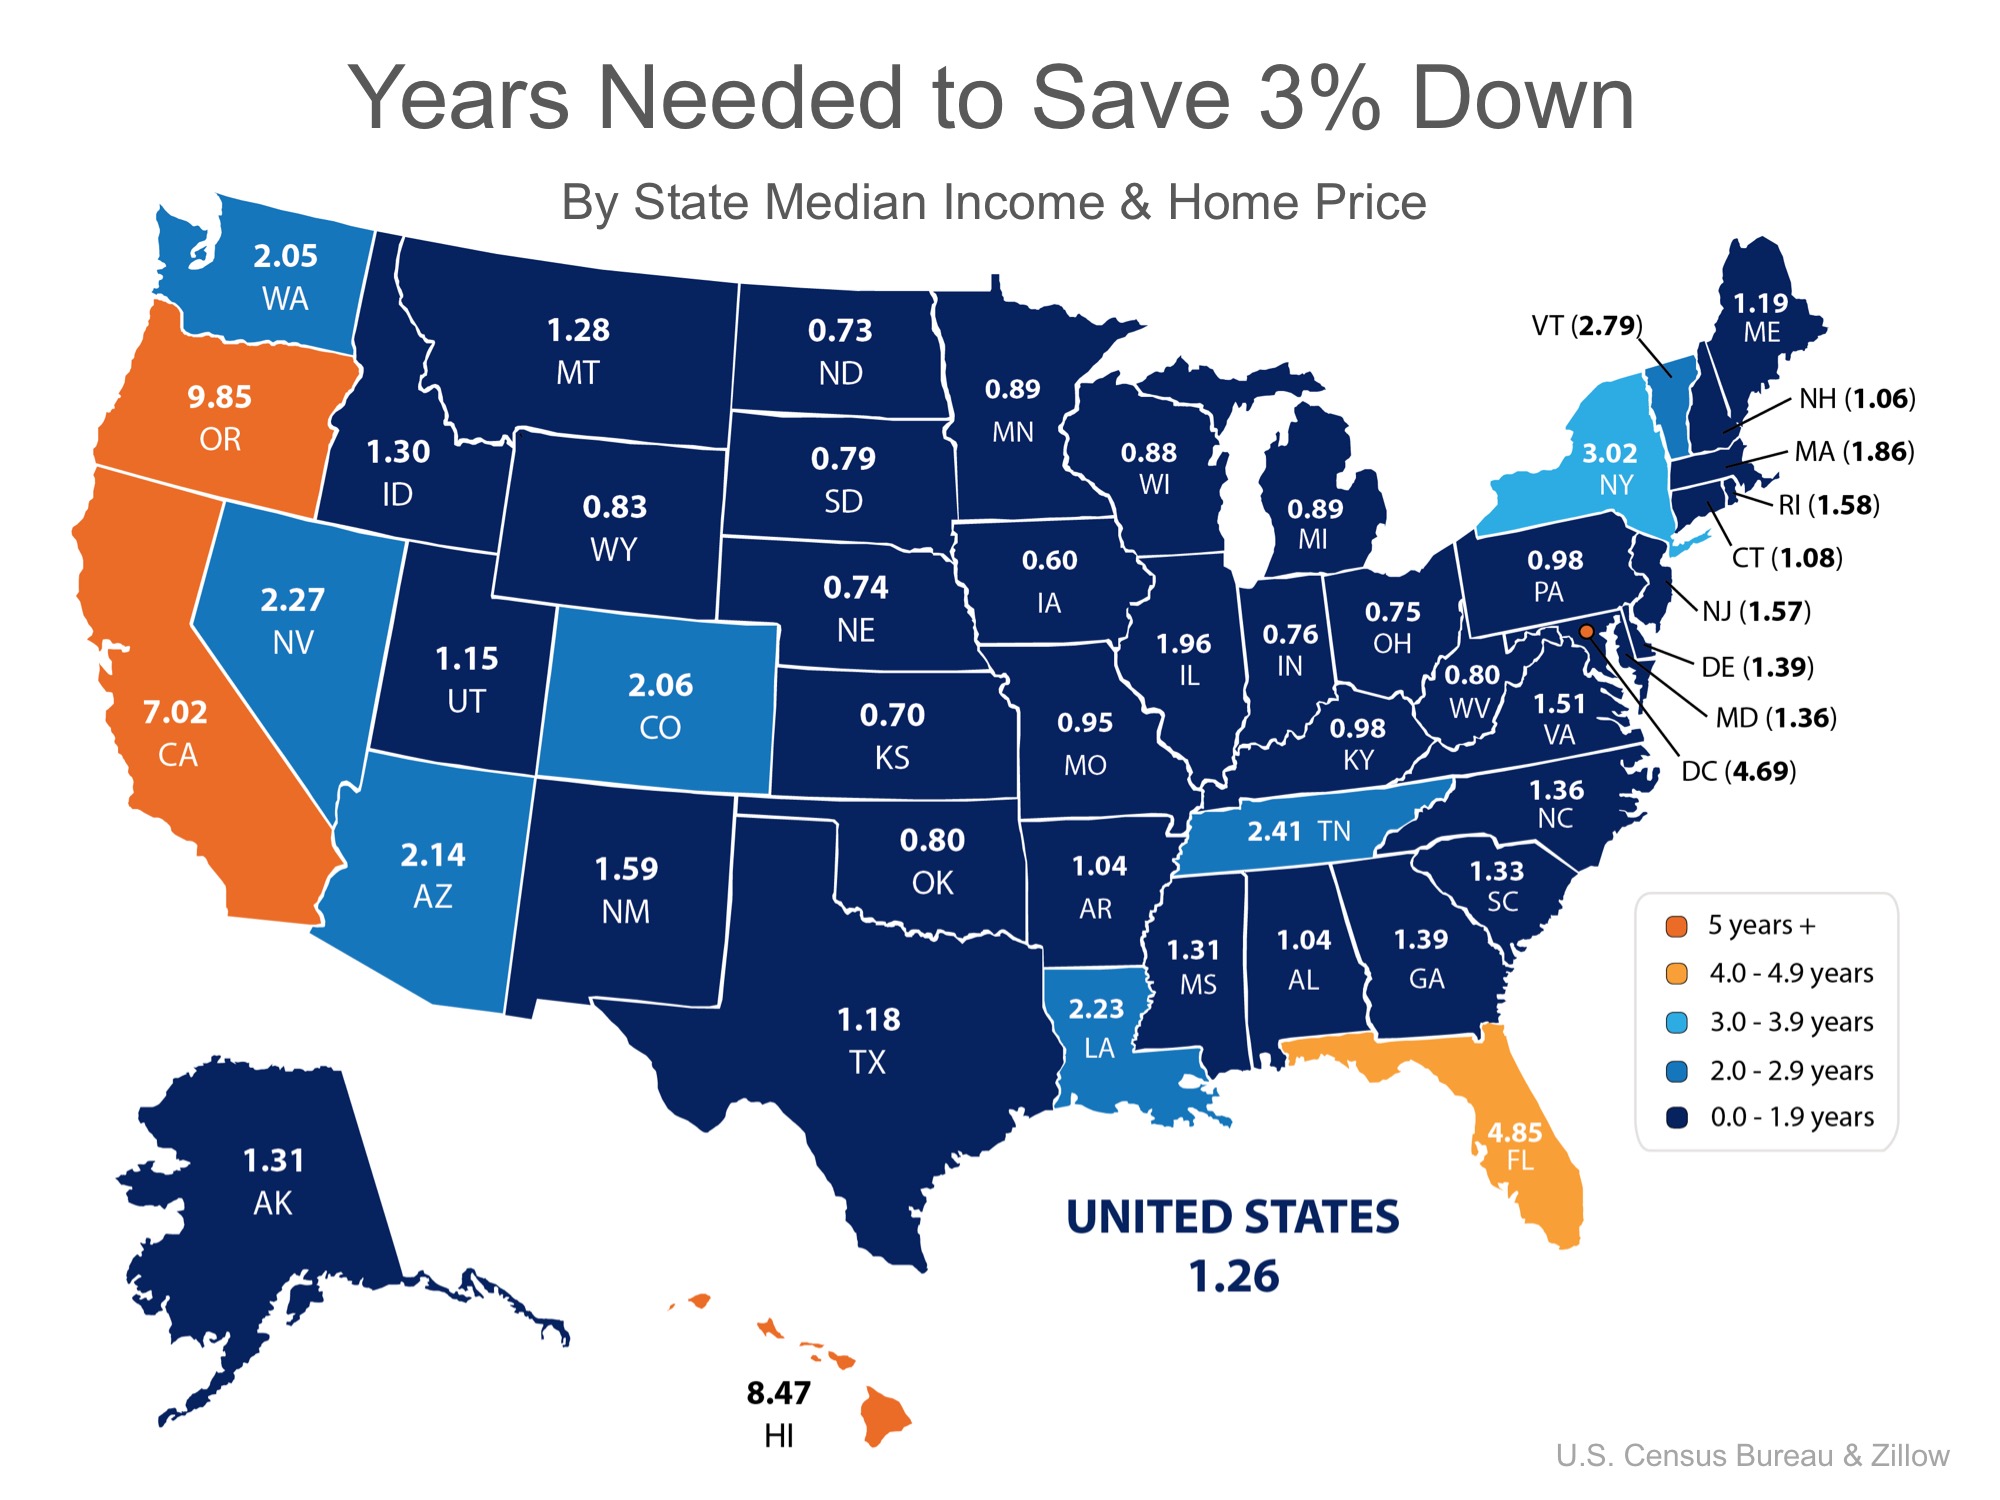
What if you only needed to save 3%?

What if you were able to take advantage of one of Freddie Mac’s or Fannie Mae’s 3% down programs? Suddenly, saving for a down payment no longer takes 5 or 10 years, but becomes attainable in a year or two in many states as shown in the map below.

How Fast Can You Save for a Down Payment? | MyKCM

Home Selling March 17, 2017

How to Price a Home Right?

Six Factors That Affect the Sales Price of Your Home

Pricing a home for sale is not nearly as simple as most people think. You can’t base the price on what the house down the street sold for. You can’t depend on tax assessments. Even automatic valuation methods (AVMs), while useful for a rough estimate of value, are unreliable for purposes of pricing a home for sale.

AVMs, like those used by Zillow and Eppraisal, have been used for many years by banks for appraisal purposes. They are derived from algorithms based on past sales. But producers of AVMs agree that they are not accurate indicators of home value. For example, Zillow.com states, “Our data sources may be incomplete or incorrect; also, we have not physically inspected a specific home. Remember, the Zestimate is a starting point and does not consider all the market intricacies that can determine the actual price a house will sell for. It is not an appraisal.”

So what does Zillow recommend sellers do instead? The same thing the real estate industry has been advising for decades: Ask a real estate agent who knows your neighborhood to provide you with a comparative market analysis. To accomplish that, I typically consider the following factors—plus others, depending on the house:


Location

The location of your home will have the biggest impact on how much it can sell for. Identical homes located just blocks apart can fetch significantly different prices based on location-specific conditions unique to each, including: traffic, freeway-access, noise, crime, sun exposure, views, parking, neighboring homes, vacant lots, foreclosures, the number of surrounding rentals, access to quality schools, parks, shops, restaurants and more.

Recommendation: Be willing to price your house for less if it’s located in a less desirable area or near a neighborhood nuisance.


Market

Another major factor that also can’t be controlled is your local housing market (which could be quite different from the national, state or city housing markets). If there are few other homes on the market in your local area (a situation known as a “sellers market”), you may be able to set a higher price. However, if there’s a surplus of homes like yours for sale (a “buyer’s market”), your pricing will also reflect that.

Recommendation: If it’s a buyer’s market and you can delay selling your home until things change, you should consider doing so. If you can’t wait, be willing to price your home extremely competitively, especially if you are in a hurry to sell.


Condition

The majority of buyers are not looking to purchase fixer-uppers, which is why any deferred maintenance and repair issues can also significantly impact the selling price of your home. When your home’s condition is different than the average condition of homes in your location, AVMs tend to produce the widest range of error.

Recommendation:  Hire a professional home inspector to provide you with a full, written report of everything that needs upgrading, maintenance or repair, then work with your real estate agent to prioritize the list and decide what items are worth completing before the property is listed for sale, and what should be addressed through a lower list price. Also, some defects are best addressed during negotiations with buyers.


Widespread appeal

If you want to sell your home quickly and for the most money, you have to make it as appealing as possible to the largest pool of prospective buyers. The more universally attractive it is, the greater the interest and the faster competing offers will come.

Recommendation:

Hire a professional home stager (not a decorator) to temporarily stage the interior of your home. Also spend time making the exterior look its best: address any peeling paint, make sure the front door/ door hardware is attractive, prune bushes and trees, remove old play equipment and outdoor structures, etc.


Compare homes

The only neighboring homes that should be used to estimate the value of your home are those that have been carefully selected by a real estate professional with special training, access to all sales records, and in-depth knowledge of the neighborhood.

Recommendation: If you’re considering selling your home, ask your real estate agent to recommend a professional appraiser.

Searchability

When working with a prospective buyer, most real estate agents will search the available inventory only for the homes priced at (or less than) their client’s maximum, which is typically a round number. If you home is priced slightly above or below that amount (e.g., $510,000 or $495,000), it will appear in fewer buyer searches.

Recommendation: Be willing to adjust your selling price to maximize visibility.


Periodic price adjustments

Pricing a home isn’t a set-it-and-forget-it proposal. As with any strategy, you need to be prepared to adapt to fast-changing market conditions, new competition, a lack of offers and other outside factors.

Recommendation: After listing your house, be ready to adjust your asking price, if necessary.

Posted in Windermere Blog by Tara Sharp